
 Welcome to the recap of today's MarketWatchers LIVE show, your antidote for the CNBC/FBN lunchtime talking heads. Our show is devoted to technical analysis of the stock market with live market updates and analysis of hot symbols. The show runs throughout the day on StockCharts TV; you can also find the latest episodes on the YouTube StockCharts channel here.
Information abounds in our Monday-through-Friday 12:00p - 1:30p shows, but the MWL Blog will give you summary slides and time stamps for viewing later. Be sure and check out the MarketWatchers LIVE ChartList for the 10 in 10 charts.
Your comments, questions and suggestions are welcome. Our Twitter handle is @mktwatcherslive, our email is marketwatchers@stockcharts.com and we also have a MarketWatchers LIVE Facebook page that you can like and follow. Don't forget to sign up for notifications at the end of this blog entry by filling in your email address.
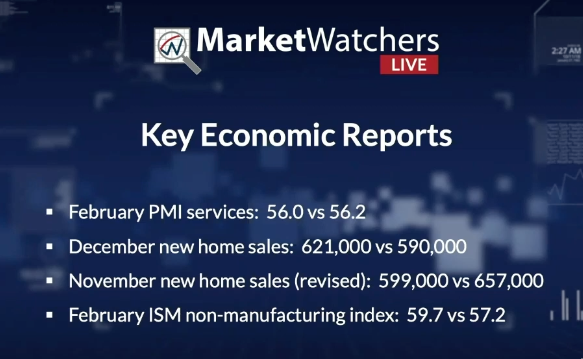
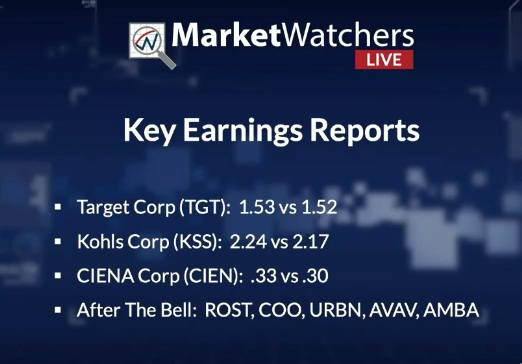
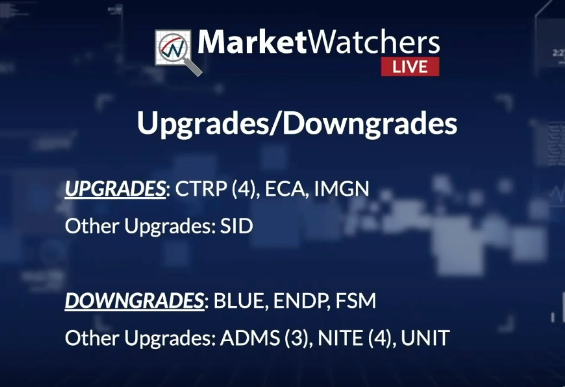
What Happened Today?
Technical News:
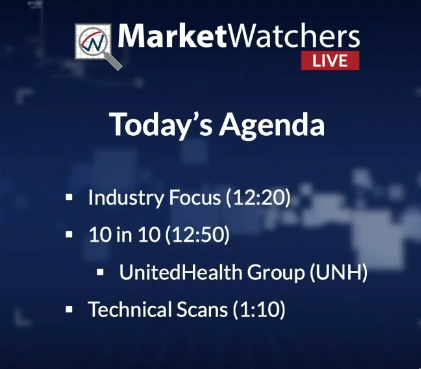
"Industry Focus" by Tom Bowley (0:22:47):

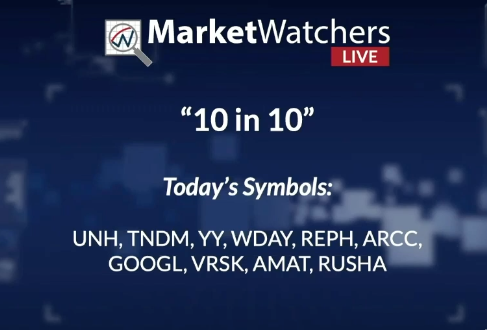
Ten in Ten Before One (0:53:49):
In this regular segment, Tom attempts to review ten charts in ten minutes. Send in your symbol requests via Twitter (@mktwatcherslive) before the show or using the live chat box during the LIVE program. We'll also check our email for symbol requests before the show (marketwatchers@stockcharts.com). You'll find all of these charts in the MarketWatchers LIVE ChartList, located at the top of the MarketWatchers blog homepage.
Technical Scans (1:14:40):
Erin's Scans are below for your convenience to copy and save:
Moving Average Crossover Scan:
[type = stock] AND [Daily SMA(20,Daily Volume) > 100000]
and [Close > 10]
and [EMA(50) x EMA(200)]
5-EMA Crossover Scan:
// Narrows down the universe to US stocks with decent volume and a close above $10
[type = stock] AND [Daily SMA(20,Daily Volume) > 50000]
AND [country is US]
AND [Close > 10]
// This identifies a PMO that hasn't yet had a positive crossover its signal line
AND[today's PMO Line(35,20,10)<today's PMO Signal(35,20,10)]
AND [today's PMO Line(35,20,10) > yesterday's PMO Line(35,20,10)]
AND [yesterday's PMO Line(35,20,10) > 2 days ago PMO Line(35,20,10)]
AND [2 days ago PMO Line(35,20,10) > 3 days ago PMO Line(35,20,10)]
// Stock is in a "bull" market - 50-EMA higher than 200-EMA
AND [today's ema(50,close) > today's ema(200,close)]
// Stock just had a 5-EMA positive crossover 20-EMA - Short-Term bullish
AND [today's ema(5,close) X today's ema(20,close)]
General PMO Scan:
// Narrows down the universe to stocks with decent volume and from the US
[type = stock] AND [Daily SMA(20,Daily Volume) > 100000]
AND [country is US]
// Keeps the penny stocks and high volatility stocks out of your results
AND [Close > 10]
// This identifies a PMO that hasn't yet had a positive crossover its signal line
AND[today's PMO Line(35,20,10) < today's PMO Signal(35,20,10)]
// This identifies a PMO rising for three days
AND [today's PMO Line(35,20,10) > yesterday's PMO Line(35,20,10)]
AND [yesterday's PMO Line(35,20,10) > 2 days ago PMO Line(35,20,10)]
AND [2 days ago PMO Line(35,20,10) > 3 days ago PMO Line(35,20,10)]
//This ensures we get a positive IT and LT Trend Model configuration
AND [today's ema(20,close) > today's ema(50,close)]
AND [today's ema(50,close) > today's ema(200,close)]
//This identifies stocks with SCTRs greater than 75 or in the "hot zone"
AND [SCTR > 75]
Focused PMO Scan:
// The "universe" you are scanning:
[group is CyclicalsSector]
OR [group is CommunicationServicesSector]
AND [Daily SMA(20,Daily Volume) > 100000]
// PMO has not yet had a crossover:
AND[today's PMO Line(35,20,10)<today's PMO Signal(35,20,10)]
// PMO Rising for last three days:
AND [today's PMO Line(35,20,10) > yesterday's PMO Line(35,20,10)]
AND [yesterday's PMO Line(35,20,10) > 2 days ago PMO Line(35,20,10)]
AND [2 days ago PMO Line(35,20,10) > 3 days ago PMO Line(35,20,10)]
// Positive Line-up of EMAs 20-EMA > 50-EMA > 200-EMA (Implies Stock is in an IT or LT Bull market:
AND [today's ema(20,close) > today's ema(50,close)]
AND [today's ema(50,close) > today's ema(200,close)]
Bottom Fishing Scan:
// Narrows down the universe to stocks with decent volume and from the US
[type = stock] AND [Daily SMA(20,Daily Volume) > 100000]
AND [country is US]
// Keeps the penny stocks and high volatility stocks out of your results
AND [Close > 10]
// This identifies a PMO that hasn't yet had a positive crossover its signal line and PMO below zero
AND[today's PMO Line(35,20,10) < today's PMO Signal(35,20,10)]
AND[today's PMO Line(35,20,10) < 0]
// This identifies a PMO rising for three days
AND [today's PMO Line(35,20,10) > yesterday's PMO Line(35,20,10)]
AND [yesterday's PMO Line(35,20,10) > 2 days ago PMO Line(35,20,10)]
AND [2 days ago PMO Line(35,20,10) > 3 days ago PMO Line(35,20,10)]
//Trend Model Configuration with only ST Trend Model on BUY
AND [today's ema(20,close) < today's ema(50,close)]
AND [today's ema(50,close) < today's ema(200,close)]
AND [today's ema(5,close) > today's ema(20,close)]
//This identifies stocks with SCTRs less than 75 or in the "hot zone"
AND [SCTR < 75]
Momentum Sleepers Scan:
[type = stock]
and [country is US]
AND [Daily SMA(20,Daily Volume) > 50000]
AND [Close > 10]
AND [Daily SMA(20,Daily Volume) > 40000]
AND [Daily PMO Line(12,26,9,Daily Close) < 0]
AND [Daily PMO Line(12,26,9,Daily Close) >= Daily PMO Signal(12,26,9,Daily Close)]
AND [Yesterday's Daily PMO Line(12,26,9,Daily Close) < Yesterday's Daily PMO Signal(12,26,9,Daily Close)]
AND [2 days ago Daily PMO Line(12,26,9,Daily Close) < 2 days ago Daily PMO Signal(12,26,9,Daily Close)]
AND [3 days ago Daily PMO Line(12,26,9,Daily Close) < 3 days ago Daily PMO Signal(12,26,9,Daily Close)]
Looking Forward:
Tune in on Wednesday at 12:00p-1:30p EST for guest Milan Vaishnav.
Helpful MarketWatchers LIVE Links:
Facebook - MarketWatchers LIVE Page
YouTube Channel for StockCharts
Tom's Price Relative Chart (Save this ChartStyle to apply it to your charts anytime!)
PMO -Price Momentum Oscillator
