Even a limited, restrictive program, such as the Federal Thrift Savings Plan, can be managed for greater gains with smaller losses. My Plan IQ shows us a successful formula that’s been tracked in real time since 2001. And StockCharts enables investors to apply the method to the plan — free of charge.

Parts 1, 2, and 3 of this column appeared on Nov. 20, 22, and 27, 2018.
So far, we know that gradual monthly changes in the Federal Thrift Savings Plan (TSP) can give account holders almost half a percentage point more gain annually (which adds up!). We’ve also seen that a buy-and-hold of the five TSP funds subjected investors to losses of 29% in the 2007–2009 financial crisis. That would be sufficiently horrible to make many participants liquidate, with great damage to their long-term performances. Finally, we’ve identified five Vanguard mutual funds and exchange-traded funds (ETFs) that let anyone model or duplicate the performance of the restrictive set of asset classes in the TSP.
A lot of this knowledge comes to us thanks to My Plan IQ. This website shows on its free pages the funds that make up its buy-and-hold version of TSP and an improved version that uses a simple momentum rule to chose the only strongest funds each month.
Anyone can see which TSP funds My Plan IQ’s formula has recently recommended, but with a delay of one or two months. To see the recommendations as of the current date requires at least a Basic-level paid subscription, which is presently $19.95 per month. (Disclosure: I’ve been a paying subscriber since June 2013, not because I have a TSP account, but to get the site’s other market research data.)
StockCharts.com comes to the rescue
If you don’t wish to subscribe to all of My Plan IQ’s services, you can get the same recommendations for free by using the PerfChart feature of StockCharts.com. It’s more work — you have to run the numbers yourself every month, whereas My Plan IQ does all of the crunching for you — but you can’t beat the price!
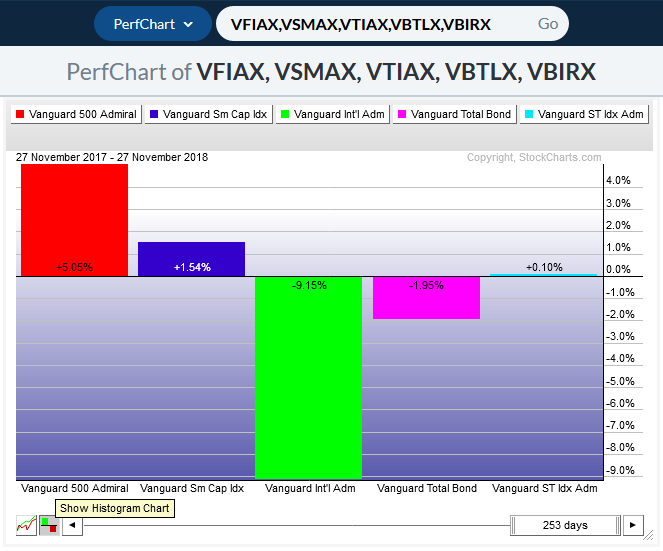
Figure 1. StockCharts.com’s PerfChart feature allows you to find the gain or loss of almost any security over the past 12 months or any other reasonable period of time.
We saw in Part 3 of this column the symbols for the five Vanguard mutual funds and ETFs that best match the offerings of TSP. My Plan IQ determines which of the five to actually hold each month using the same formula as in all its other “tactical” plans. This formula is the average of five numbers: the five funds’ total gain or loss over the past 12 months, 6 months, 3 months, 1 month, and 1 week. Refer to Figure 1, shown above, for an example of what you should see when you finish Step 3, below. The following procedure in StockCharts accomplishes the calculation:
Step 1. For our purposes here, we define the average month as 21 trading days, a year as 252 trading days, and so forth. Using this rule works around months that don’t have a regular “31 days, then 30 days” pattern, such as February, July, and December.
Step 2. Use the following hyperlink to open a PerfChart showing the gains of the mutual funds VFIAX, VSMAX, VTIAX, VBTLX, and VBIRX for 252 days, as we define one year. (Note: StockCharts uses 253 to represent 252 trading days, adding 1 to the actual number of trading days.)
See TSP PerfChart or enter the following into any browser (all on one line):
https://StockCharts.com/freecharts/perf.php?VFIAX,VSMAX,VTIAX,VBTLX,VBIRX&n=253&O=111000
If you prefer to buy ETFs, use the symbols VOO, VB, VXUS, BND, and BSV.
Step 3. If necessary, click the Show Histogram Chart button in the lower-left corner. This displays the percentage gain or loss of the five funds as numbers rather than as a line chart. Your browser window should look like the example in Figure 1.
Step 4. Write down the five numbers or enter them into a spreadsheet.
Step 5. Double-click “253 days” in the slider to highlight it, enter 127 to show 126 trading days (six months), and then press Enter. Note the five gains or losses over the past six months.
Step 6. Repeat Step 5, entering 64 for 63 trading days (three months), 22 for 21 trading days (one month), and 6 for 5 trading days (one week).
Step 7. Calculate the average of the five gains or losses for each of the five funds. For example:
- Say one fund has gains of 3%, 2%, 1%, 0%, and –1%.
- The average of the five numbers would be 5% divided by 5 or 1%.
Step 8. On a recurring day of the month that you select, such as the first or last trading day of each month, TSP account holders should sell any of the funds they own whose average is not ranked in the top three. Purchase any funds that are in the top three that are not already owned.
Step 9. My Plan IQ requires that its “tactical” version of TSP allocate at least 40% at all times to fixed-income: namely, the VBTLX mutual fund or the BND exchange-traded fund.
Step 10. Allocate the other 60% of the TSP account equally (30% and 30%) between whichever two other funds have the highest average gain or loss you computed. If a fund’s average is negative, hold VBTLX or BND that month instead.
Step 11. Don't worry about rebalancing the funds to exactly equal weight unless one of the funds is more than 20% off its ideal dollar value in your portfolio. Gobind Daryanani, Ph.D, showed in a recent Journal of Financial Planning article that a 20% deviation from equal weight is a more profitable rebalancing trigger for a diversified portfolio than the conventional wisdom of 5%.
An improved portfolio is not an ideal portfolio
The preceding steps should help anyone who’s trapped in the Thrift Savings Plan — or any similarly restrictive program — to get better long-term gains with much smaller losses along the way.
But is the TSP something that independent investors should copy? Absolutely not!
If you have the ability to pick any mutual funds or ETFs you want, you can enjoy much better gains than is possible with the limited selection available to TSP participants. For the best returns with only tolerable losses in any 401(k) or similar plan, see my Muscular Portfolios summary.
The TSP is still a good deal for federal employees and members of the military. For one thing, the US government adds 1% to eligible workers’ accounts — whether or not they contribute any of their salaries themselves. And on top of that, there’s a generous match of up to 5% of salary, depending on which agency or branch of service the participant works for.
When leaving federal employment, however, TSP participants should seriously consider a rollover from their TSP account into an individually managed IRA. Almost every brokerage that supports IRAs gives investors a much wider selection of funds to choose from, including all of the global asset classes that make up a Muscular Portfolio.
Take advantage of any match the federal government or a private employer may offer you. But if a 401(k) fee is high or its choices are as limited as TSP’s, you can do better with your own account when you leave the job.
With great knowledge comes great responsibility.
—Brian Livingston
CEO, Muscular Portfolios
Send story ideas to MaxGaines “at” BrianLivingston.com