Adding one simple change raises the Bucket Portfolio’s annualized rate of return by an enormous 3½ percentage points. Over a 45-year investing career, that would result in an ending value more than four times larger than the static, unchanging Lazy Portfolio version. The only difference is a Momentum Rule, which can be applied to other portfolios even more effectively than the Bucket model allows.
Parts 1 and 2 of this column appeared on Nov. 6 and 8, 2018.
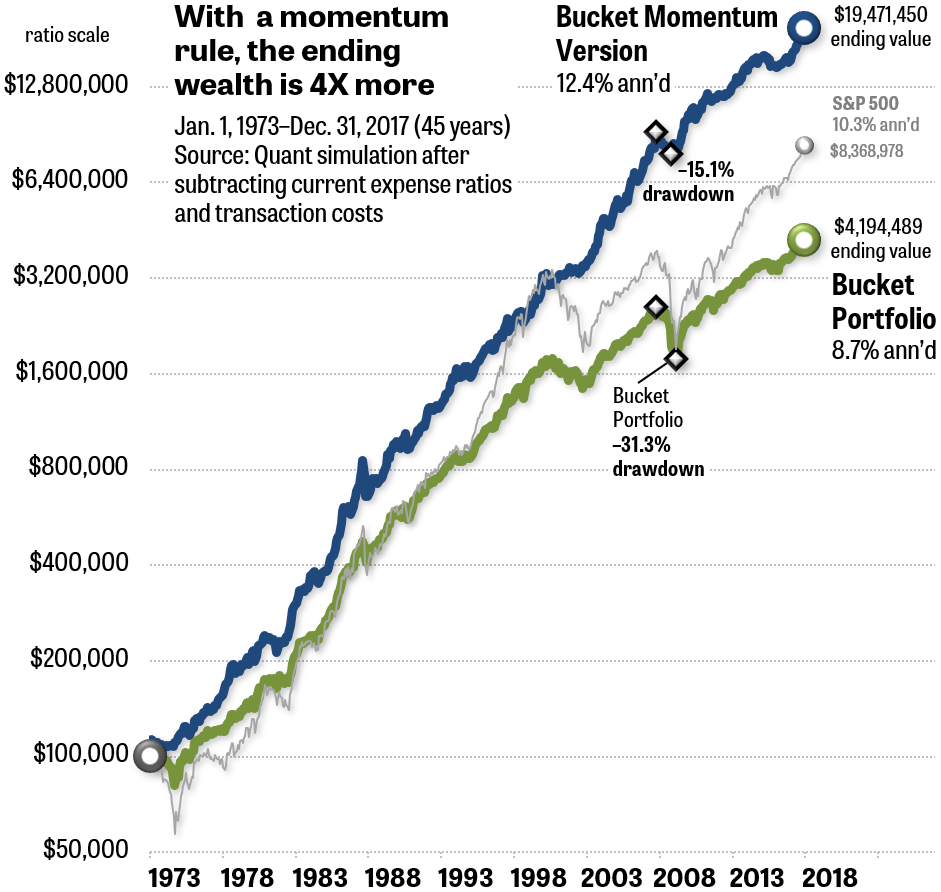
As we saw in the previous parts of this column, the Aggressive Retirement Bucket Portfolio promoted by the giant investment advisory firm Morningstar Inc. underperformed the S&P 500 in 45-year simulations. The lag occurs primarily because the Bucket Portfolio never changes its position. This is same for all Lazy Portfolios, of which there are many slight variations.
The Bucket Portfolio always holds nine asset classes (mutual funds or ETFs) in the same percentages that I showed in Part 1. A static asset allocation cannot tilt your portfolio toward assets that are in uptrends and away from assets that are in downtrends — even when those trends are obvious.
The solution to the problem is illustrated in the image above. Researchers and economists have proven in hundreds of peer-reviewed papers beginning in 1993 that momentum is arguably the most powerful factor that predicts anything about future asset prices. Of course, traders have known for hundreds of years that “the trend is your friend.” But academics have repeatedly demonstrated a simple rule: Asset classes that have risen in price in the past 3 to 12 months tend to rise in the next one month. As documented in my Muscular Portfolios summary, even financial experts who once believed that markets were perfectly efficient now say, “All models that do not include a momentum factor fare poorly.” (Fama & French, 2014.)
Of course, taking advantage of momentum means you must check an asset-class portfolio once a month and make gradual course corrections when necessary. You can’t just let your portfolio drift. This is the difference between the green and blue lines in the above image. The green line represents the conventional Bucket Portfolio, with its nine asset classes held in the exact percentages specified by Morningstar on its website. The blue line represents a version with a Momentum Rule.
See the difference in returns and judge for yourself
The ordinary Bucket Portfolio returned 8.7%, while the version improved with a Momentum Rule returned 12.4% — a difference of 3.7 percentage points. A few percentage points may not sound like a lot. But many experts point out that any time you can improve your portfolio’s return by even one-half of a percentage point, you should do it, perhaps by reducing the annual fees you pay to a fund or a financial adviser. Starting with $100,000, the ending value of the Lazy Portfolio would have been only $4,194,000, while the owner of the momentum version would have had $19,471,000.
You would have achieved double the gain — a durable profit of $44,368 rather than only $20,837 on your original $100,000 — at the end of just the first 4½ years. Tuning up your portfolio once a month — which can take you as little as 15 minutes — would have given you 4.6 times more ending wealth after 45 years.
To be clear, the Bucket Portfolio was designed by Morningstar for people who are making withdrawals in retirement. Distributions aren’t shown in the above graph. But you can easily imagine that a retired person or couple could take larger withdrawals with a Momentum Rule than without one (although the withdrawal rate couldn’t be 3.7 percentage points more).
Both of the lines in the graph assume that each investor is paying 0.38% in annual fees. That’s the weighted average of the mutual funds specified by Morningstar (and listed in Part 1 of this column). Those mutual funds include offerings from Vanguard, Fidelity, Harbor, American Funds, and Loomis Sayles. Naturally, you might be able to eke out slightly smaller fees using exchange-traded funds. But both portfolios in the graph are dinged by the same fees of the funds that are specified by Morningstar.
The blue line representing the momentum version of the portfolio is also charged 0.1% in trading friction every time the portfolio changes one asset class for another. That’s a generous estimate of what it costs to trade today’s highly liquid funds. The simulation shows that only 6.23 changes (12.46 trades) would be required per year, on average. That’s just one change about every two months. Adding a Momentum Rule to a portfolio doesn’t require short-term trading.
The S&P 500 is shown in the above graph as a thin gray line to make the other two portfolios stand out. In the simulation, the index was charged 0.04% in annual fees, similar to today’s cost of holding Vanguard’s VOO ETF or the equivalent VFIAX mutual fund. The S&P 500 portfolio was charged no trading friction, since holding such an index fund requires the investor to make no trades.
The problem that explodes a buy-and-hold strategy for most people is that the S&P 500 is crash-prone. The nominal price change of the index crashes 30% or more every 10 years, on average. The S&P 500 (including dividends) lost 51% in the 2007–2009 financial crisis from one month-end to another, as shown in the graph in Part 2. The static Bucket Portfolio subjected its followers to an almost equally horrendous 31% loss — and worse if daily closes are considered. Those losses are far beyond the 20% or 25% level that drives many individuals to liquidate, at great harm to themselves (as documented in my summary).
Incredibly, the momentum version of the Bucket Portfolio fell only 15% during the financial crisis. That’s a modest drawdown that any individual can learn to tolerate. (If you can’t accept a loss of a mere 20% to 25% during a crash of 50%, you should resign yourself to a portfolio that’s limited mostly to bonds.)
Many strategies would never work with 20th-century costs
Why do these simulations use today’s costs instead of those in 1973? For one thing, it would be impossible for us to have followed an asset-class investing strategy back then. The first ETF — SPY — wasn’t even invented until 1993. A complete suite of global asset-class ETFs wasn’t available until 2014, making this a new strategy with great promise to reduce trading expenses for individuals. For a second thing, back in 1973, buying and selling a single stock typically cost a round-trip haircut of 2%. That would have made asset rotation wholly unprofitable in last century’s markets.
Only with the ultra-low-cost funds we enjoy today has asset rotation become a profitable strategy. What we want to know with our simulations is how we can make the most profits going forward, not backward. The future will not be the same as the past, but as long as global markets continue to have bull and bear phases — as they certainly will for the rest of our lives — we can use gradual asset rotation to get into those funds that are in uptrends and out of those that are in downtrends (as I describe below).
I created the above graph and the one in Part 2 using the Idea Farm’s Quant simulator. This is one of the few tools that subtracts trading commissions and annual fees. I call Quant a simulator rather than a backtester, because the program contains no stock prices from the past. Instead, it provides extensive histories of actual asset classes, including indexes of stocks, bonds, real-estate investment trusts (REITs), commodities, and gold. Today, ETFs capture 99% of any asset class’s return. After decades of paying high fees, we can now buy low-cost index funds that once would have required hundreds of transactions to duplicate. (The Quant program can be requested from Mebane Faber as a free bonus upon a $399 subscription to his Idea Farm Newsletter.)
Asset rotation kept the momentum portfolio in uptrends
How did the momentum version of the Bucket Portfolio accomplish a much greater return than the static version with much smaller drawdowns? Isn’t that impossible? No, it’s not impossible at all, now that we have super-cheap index funds and a scientific consensus on how the momentum factor works.
During the three calendar years of the financial crisis, 2007 through 2009, the momentum portfolio made only 14 position changes — about four or five per year. The Momentum Rule determined which three asset classes to hold each month using the same formula as the best-performing strategy revealed in my new book Muscular Portfolios. You simply average each asset class’s total return over the past 3, 6, and 12 months and hold each month the three index funds that rank the highest. No more than one addition and one deletion were required in any month in this period, representing only 33.3% of the portfolio (although up to three changes are possible in a given month). The additions that replaced lower-rated funds during that three-year period — selecting from Morningstar’s specified asset classes — were:
Mar. 1, 2007 — High-yield bond fund
May 1, 2007 — Total US stock-market fund
Dec. 1, 2007 — Treasury Inflation-Protected Securities (TIPS)
Jan. 1, 2008 — 10-year Treasury fund
Feb. 1, 2008 — US corporate investment-grade bond fund
Mar. 1, 2008 — Emerging-market stock fund
Apr. 1, 2008 — US corporate investment-grade bond fund
May 1, 2008 — Emerging-market stock fund
July 1, 2008 — Treasury bills (money-market fund)
Dec. 1, 2008 — US corporate investment-grade bond fund
Apr. 1, 2009 — Treasury Inflation-Protected Securities (TIPS)
June 1, 2009 — Emerging-market stock fund
Sept. 1, 2009 — Developed-market stock fund
You can see how the Momentum Rule gradually tilted the portfolio away from US stock funds and into bond funds, beginning as early as Dec. 1, 2007. That was just after the October 2007 peak but well before Lehman Brothers declared bankruptcy on Sept. 15, 2008, which drove the already falling stock market into an even deeper dive. Before free markets crash, they lose momentum. This simple feature of our human herding instinct is what allows momentum to tell us which asset classes are in uptrends and which are in downtrends.
Momentum isn’t a crystal ball, and it isn’t magic. But the rule got investors back into emerging-market stocks as early as June 1, 2009 — less than four months after the bear-market low of Mar. 9, 2009 — and back into developed-market stocks as early as Sept. 1, 2009. Those dates are far earlier than people who panicked and liquidated in 2008 got back in. Many of them avoided any stock positions for 12 months, 24 months, or even longer. People who bought when the market was exciting and sold when the market was scary missed the powerful upmove that the world’s equity markets delivered in 2009 and most of the time since then.
Does this mean you should invest your money using a momentum version of the Bucket Portfolio? Absolutely not! Strategies that have been developed by financial experts with momentum in mind and proven with real money work much better. We’ll see that in Part 4 of this column, which appears on Nov. 15, 2018.
With great knowledge comes great responsibility.
—Brian Livingston
CEO, Muscular Portfolios
Send story ideas to MaxGaines “at” BrianLivingston.com