When professional advisers and newsletter editors are most bullish about the market, the Dow and the Russell 2000 go down, not up. • When they’re most bearish, large caps and small caps go up, not down. What explains the backwardness? Hulbert’s tracking confirms the essential findings of ‘behavioral finance’ — the human mind becomes overconfident and consistently guesses wrong.
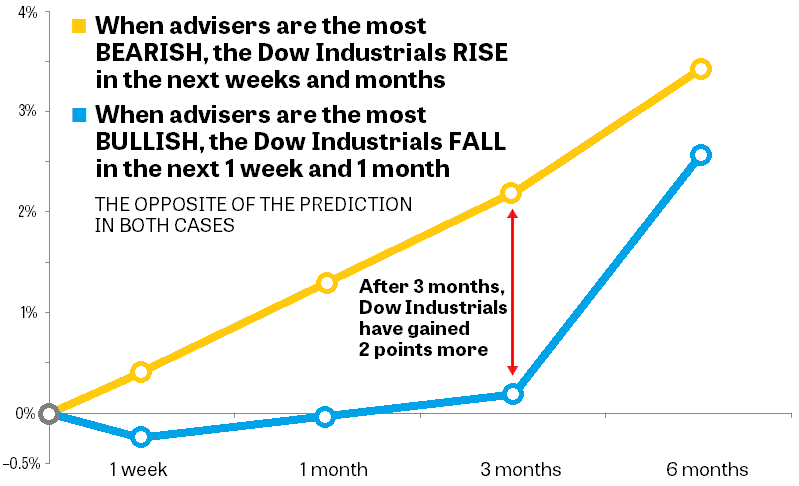
Figure 1. The most bearish and bullish predictions occur before rises and declines in the stock market that are exactly the opposite of what most advisers expected. Source: Hulbert Sentiment Indices.
• Parts 1 and 2 of this column appeared on Dec. 18 and 20, 2018. •
How does Hulbert get his estimates of how bearish or bullish financial advisers may be? In an interview, he explained to me that he subscribes to about 100 different advisory newsletters and online services. The number fluctuates as older metrics drop off the radar and new ones arise to take their place.
Every market day, Hulbert then averages the positions that each adviser is recommending for stocks, bonds, or gold. About one-tenth of the readings for the US stock market — i.e., the most bullish decile — are 60% or higher. A sentiment reading of 60% could mean that half the advisers are recommending a 100% position in stocks, while the other half are recommending 20% in stocks and the rest in cash. Of course, any combination of positions that averaged out to 60% would produce the same reading.
The formula works the same way when advisers, on the whole, are bearish. One-tenth of the sentiment readings are below –3%. Some advisers might be recommending a –13% short position in the US equity market while others are very cautious and recommend a long position of just +7%. The average reading would be –3%.
Figures 1 and 2 on this page were revealed by Hulbert in a keynote address at the American Association of Individual Investors (AAII) National Conference in October 2018. To the best of my knowledge, these charts have never before appeared on the Web. I’ve simply added headlines and markers to Hulbert’s graphs — which I believe deserve a much wider audience. The indicators have not been “purified,” as defined previously, which might make the numbers work even better. (Disclosure: I am president of the Seattle regional chapter of AAII.)
The market does whatever will surprise most traders
Figure 1 reveals what happens in the six months after advisers, on the whole, are in the most bullish or bearish tenth of their readings. Here’s a clue: The recommendations are terrible!
When the advisers are the most bearish, the Dow actually rises in every period Hulbert tracks: one week, one month, three months, and six months. When the advisers are the most bullish, the index actually falls for the next one week or one month, on average.
Three months after a strongly bearish reading, the Dow rose 2 percentage points more than the Dow did the same number of months after a very bullish reading!
The fact that financial advisers are contrary indicators is exactly what the new science of behavioral finance explains. Our minds deceive us about the markets. For example, in a study of 10,000 randomized traders’ accounts, professor Terrance Odean found that the average stock the traders bought went up 5.7% in the next 12 months. But the stock the traders sold went up 9.0%. Our choices are skewed by our own overconfidence. We aren’t aware of this, making it all the more dangerous. (See my Muscular Portfolios summary for more info.)
The same is true with small caps, not just large caps
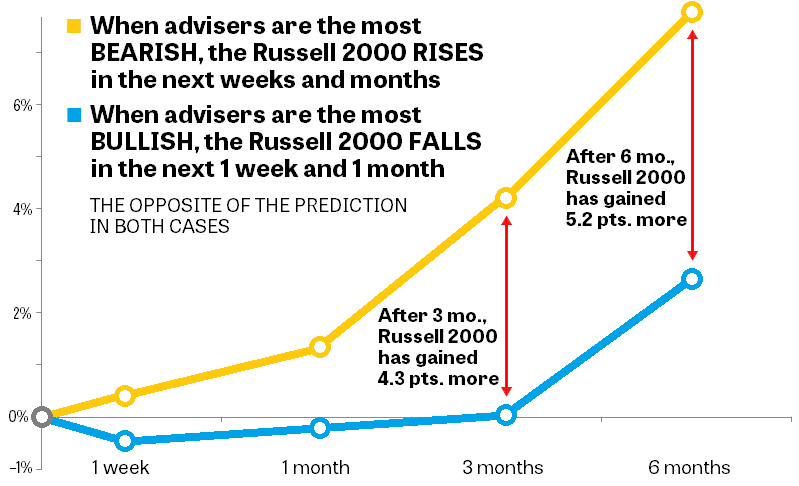
Figure 2. Advisers’ wrong-way guesses are even more pronounced when compared to the Russell 2000 Index, which includes many small-cap stocks. Source: Hulbert Sentiment Indices.
Lest you think that Hulbert’s findings apply only to the DJIA, the same backwards recommendations bedevil advisers’ predictions when applied to the small-cap Russell 2000 Index. Once again, the most bullish pronouncements by the advisers are followed by the Russell 2000 dropping during the next one week and one month, on the average.
Three to six months after the most bearish notices by the advisers, the Russell 2000 was 4 to 5 percentage points above where the index was three to six months after the most bullish positions.
What about the current situation? As I write this, the Dow (not including dividends) is down 18.8% from the all-time high it hit on Oct. 3, 2018. I’m glad you asked about the sentiment readings! After the close on Oct. 3, the average adviser was very bullish, recommending a 70% position in stocks. That was one of the highest readings of the year, and — just like clockwork — the market has been almost straight down since then. Bad advice!
I’m not advocating that you try to use Hulbert’s averaging system to time the market. What was average in the past might not be average in the future. There are a lot of variables that a single number can’t express.
Hulbert’s findings are best used as a cautionary tale. An adviser’s confidence in his or her system can’t be relied on. Track records of a few years are not evidence that any adviser will repeat that performance in the future. Long-term investors are best off making only gradual changes in a diversified portfolio, rather than jumping into and out of the market.
None of this is to say that no one ever makes an accurate prediction. I’m sure some gurus are better than others. It’s just that, on the whole, the odds are against you to find someone who’s consistently psychic about the market.
In Part 4 of this column, we’ll see how well advisers’ predictions work for interest rates, bonds, and gold. Will the predictions be better or even worse?
• Part 4 appears on Dec. 27, 2018.
With great knowledge comes great responsibility.
—Brian Livingston
Send story ideas to MaxGaines “at” BrianLivingston.com