The Ideal Index Portfolio is intended to give you a relatively aggressive allocation to equities, evenly split between US and international stocks. • That risk-on strategy gave Ideal a slightly better four-decade performance than the S&P 500 (including dividends). But it also resulted in an estimated 43% loss during the 2007–2009 bear market, worse than many investors can or will tolerate.

Figure 1. The Ideal Index Portfolio equally balances US stocks and non-US stocks in its static asset allocation model. The positions do not change over the years as asset classes rise and fall in price. Photo by William Potter/Shutterstock.
• Part 7 of a series. Parts 1, 2, 3, 4, 5, and 6 appeared on June 11, 13, 18, 20, 25, and 27, 2019. •
We saw in the first part of this series that a number of basic investment strategies called Lazy Portfolios (static asset allocation portfolios) developed around the 1990s. These simple formulas were intended to take advantage of the relatively new phenomenon of index mutual funds that tracked a wide variety of US and international asset classes.
The Ideal Index Portfolio was described in 2002 in the book The Informed Investor by Frank Armstrong III. In 1993, he founded Investor Solutions Inc., a fee-only registered investment advisory firm based in Coconut Grove, Florida.
Ideal is designed to give you a relatively aggressive 70% allocation of your portfolio into equities and equity-like assets (including real-estate investment trusts or REITs). This 70% proportion of equity-like assets is slightly higher than the typical 60% stocks/40% bonds allocation of most Lazy Portfolios.
The equity portion of the portfolio has a larger commitment to international equities than many Lazy Portfolios, with 31% in global stocks and another 31% in US stocks. An 8% allocation to REITs makes up the remainder of the equity-like holdings. The other 30% of your money is devoted about two-thirds to US government debt and one-third to corporate investment-grade debt, all with short-term maturities (one to five years):
- 6.25% US large-cap stocks
- 9.25% US large-cap value stocks
- 6.25% US small-cap growth stocks
- 9.25% US small-cap value stocks
- 31% all non-US stocks
- 8% US real-estate investment trusts (REITs)
- 30% US short-term government and corporate investment-grade bonds
For more information on these asset classes and specific funds that index them, see the breakdown at My Plan IQ, a website that tracks thousands of 401(k) programs and other investing strategies.
The 2007–2009 global financial crisis drove Ideal to a loss of 43% between month-ends, according to the Quant simulator, as shown below in Figure 2. The Quant program is available as a free bonus with a subscription to Mebane Faber’s Idea Farm Newsletter ($399 per year).
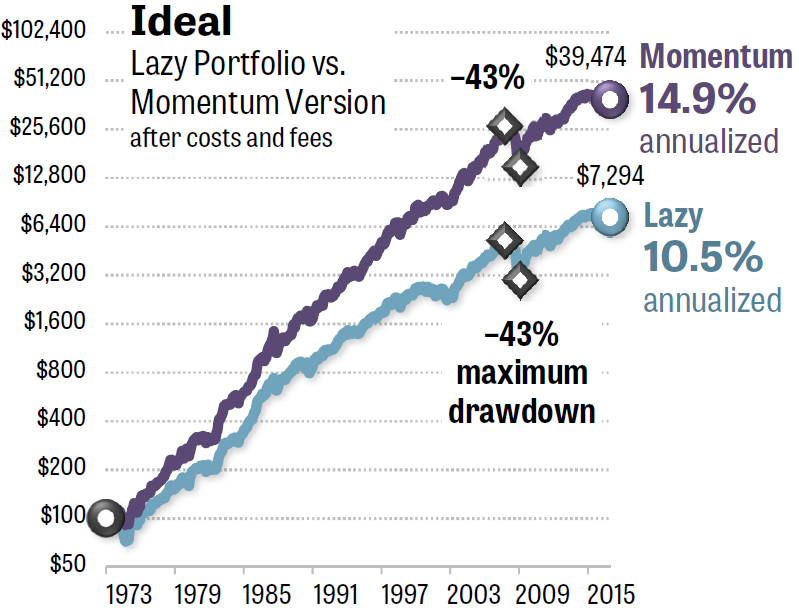
Figure 2. The Ideal Index Portfolio would have given investors 4.4 points more annualized return if followers held only the strongest three funds each month, compared with constantly holding all seven funds. Unfortunately, adding a Momentum Rule did not give the alternative version a maximum drawdown any smaller than the static version of the portfolio. Both versions fell 43% during the 2007–2009 bear market. Source: The Idea Farm’s Quant simulator.
All of the Lazy Portfolios in this series were enhanced using exactly the same Momentum Rule, as follows:
- At the end of each month, you average the total return of each asset class over the past 3, 6, and 12 months.
- In the following 30 days, you hold only the three asset classes with the strongest average return.
This Momentum Rule is similar to a formula Faber published in a 2013 white paper at the Social Sciences Research Network (SSRN).
As you can see in Figure 2, Ideal’s long-term performance greatly improves when you hold only the strongest three asset classes in any given month. The annualized return of the Lazy Portfolio version was 10.5%. That’s slightly better than the S&P 500’s annualized total return, including dividends, of 10.0% over the same period. However, by simply adding a Momentum Rule, you boost Ideal’s theoretical return to 14.9%.
Starting with $100, the Lazy Portfolio gave you only $7,294 after 43 years. The momentum version ended up giving you $39,474 in your account — more than five times the ending value. (The proportions are the same whether you start with $1,000 or $100,000 or any other amount.)
Just adding a Momentum Rule, however, doesn’t improve Ideal in every way. The momentum version of Ideal would have experienced no difference in the portfolio’s losses during the 2007–2009 bear market, compared with the lazy version. This is the only Lazy Portfolio we’ll see in this series in which the addition of a Momentum Rule didn’t change a strategy’s maximum drawdown, either up or down.
The static asset allocation version lost 43% between month-ends in the 2007–2009 bear market, according to the Quant simulator. By contrast, the momentum version lost just as much: 43%. Losses of this magnitude are beyond the 25% “behavioral pain point” we discussed in Part 1. Drawdowns greater than 20% or 25% compel many investors to liquidate their equities, locking in their losses.
In my simulations, most of the portfolios in this series were charged 0.11% per year, representing today’s annual fees of the ETFs each portfolio would require. In addition, the momentum portfolio was charged 0.10% round-trip each time one ETF was sold and a replacement was purchased. (The Lazy Portfolios were charged nothing for trading expenses, although annual rebalancing would have imposed a small cost.)
In an interview, I asked Armstrong for his comments on the above findings. “Every academic study that looks at factors of performance believes there is a momentum factor, but they all point out that it’s extremely difficult to capture,” he said. “At this point, I wouldn’t jump into implementing it.”
In the coming parts of this series, we’ll see a few strategies that both improve their gains as well as reducing their losses when a Momentum Rule is added, as well as how to manage your money the 21st-century way.
• Part 8 appears on June 30, 2019.
With great knowledge comes great responsibility.
—Brian Livingston
Send story ideas to MaxGaines “at” BrianLivingston.com