RRG Charts December 31, 2015 at 06:11 AM
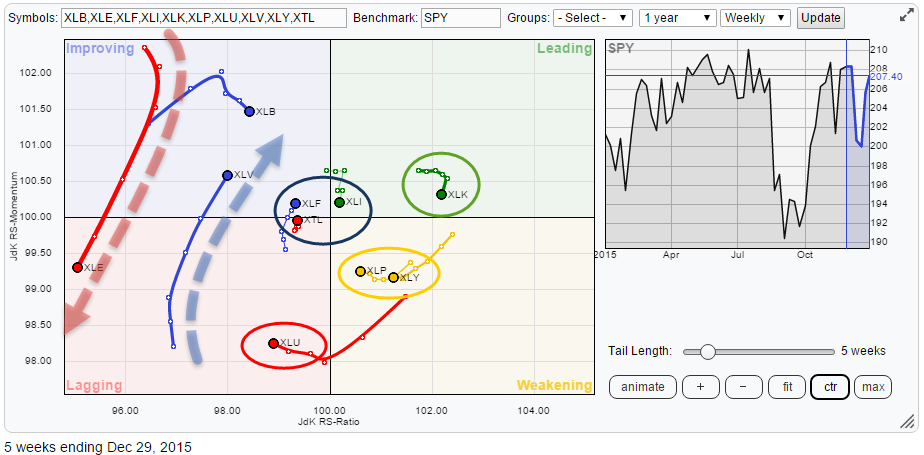
The Relative Rotation Graph for US sectors is once again showing us some interesting rotational patterns at the moment. Clearly XLE is showing us a very long tail moving from improving back to lagging again... Read More
RRG Charts December 23, 2015 at 12:48 PM
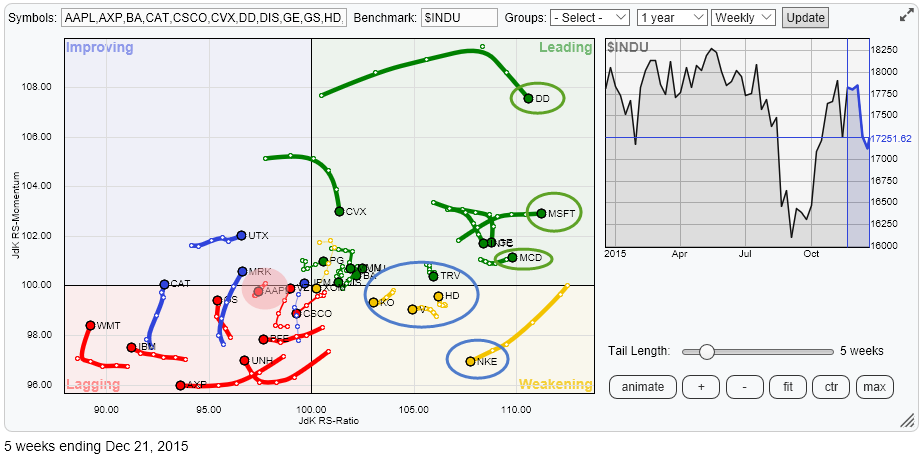
The Relative Rotation Graph with the Dow Jones Industrials stocks once again shows some interesting moves. There are a few long tails that catch my attention for a quick inspection but in this article, I want to pay a closer look at some stocks with remarkably short tails... Read More
RRG Charts December 14, 2015 at 10:23 AM
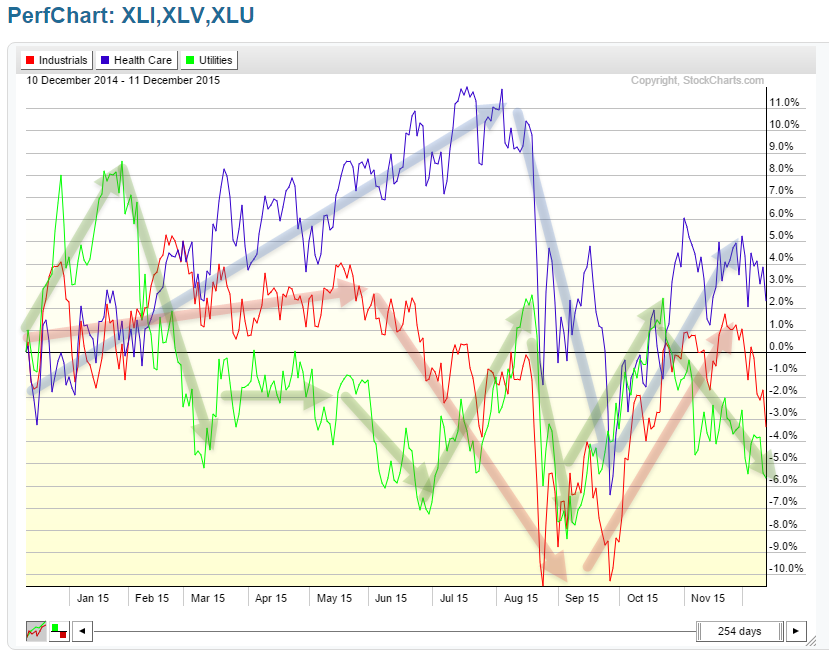
Last week I received a question from a StockCharts.com user on RRG charts via e-mail. Usually, I try to answer such questions in 1-1 fashion by replying to the particular email... Read More
RRG Charts December 09, 2015 at 09:34 AM
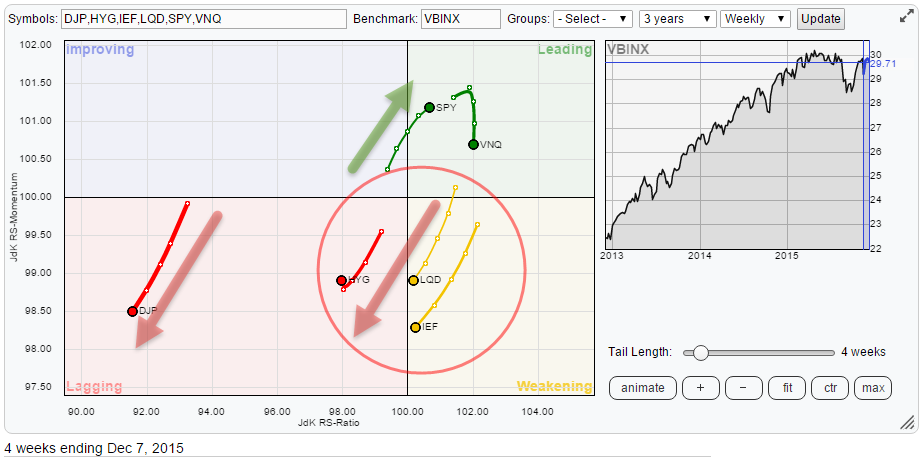
Summary Commodities keep tanking Bond related asset classes weakening Equities leading on weekly- but weakening on daily time-frame US equities continue to lead international equity markets Chinese market coming back into play Quick scan A quick look at the Relative Rotation Grap... Read More