RRG Charts November 23, 2017 at 07:38 AM
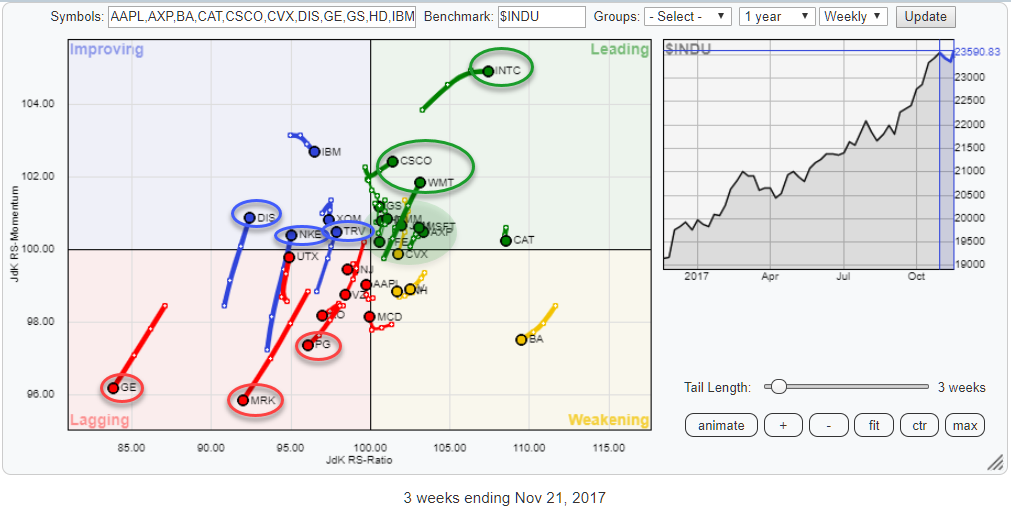
Above is the Relative Rotation Graph for the DJ Industrials index, comparing the relative rotation of all members around $INDU. On this chart, a few stocks stand out because of their clear directional moves... Read More
RRG Charts November 14, 2017 at 11:53 AM
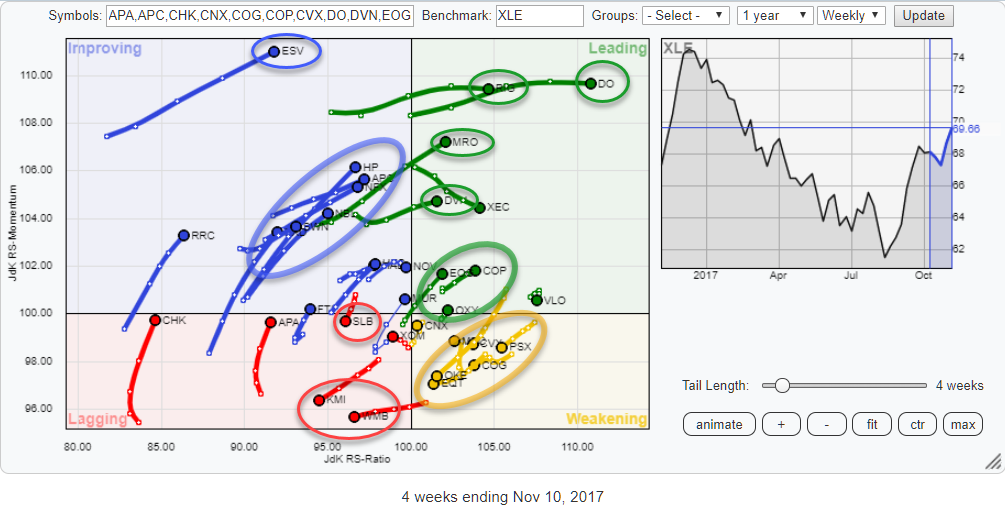
The Relative Rotation Graph above shows all the members of the S&P 500 Energy sector against XLE, the ETF that tracks the Energy sector price index... Read More