RRG Charts January 28, 2020 at 02:32 PM

In this edition of StockCharts TV's Sector Spotlight, I updated my spreadsheet for calculating the BETAs for all of the SPDR sectors. During the episode, I show users how to use this metric in combination with RRGs. This episode was originally recorded on January 28th, 2020... Read More
RRG Charts January 23, 2020 at 06:59 AM
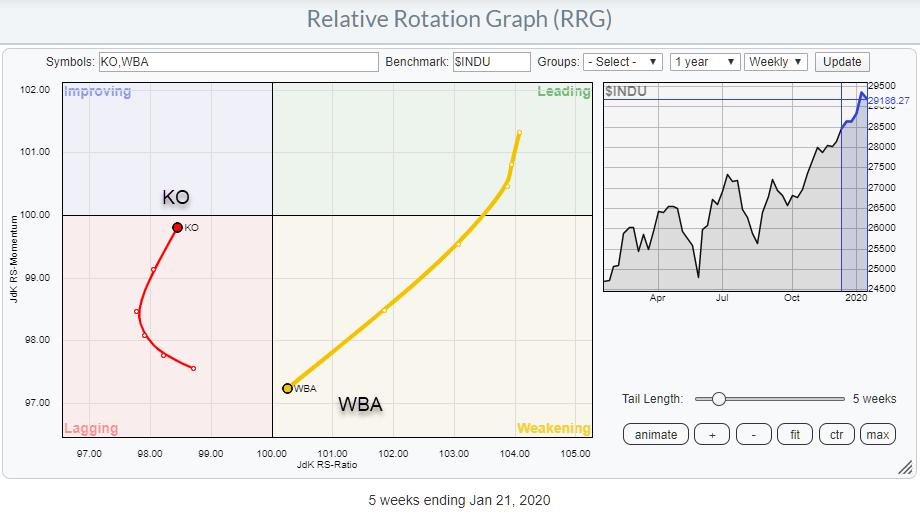
In this week's episode of Sector Spotlight, I ran out of time to go over the pair trade idea that we usually have at the end of the show and I promised to write it up in an article. So here it is. This idea was generated from the Relative Rotation Graph for the Dow 30 components... Read More
RRG Charts January 21, 2020 at 02:06 PM

In this edition of StockCharts TV's Sector Spotlight, I analyze the current rotations for US sectors and answer two questions from the mailbag. For one of those questions, I discuss the use of RRGs in short-term trading. This video originally aired on January 21st, 2020... Read More
RRG Charts January 20, 2020 at 07:59 AM
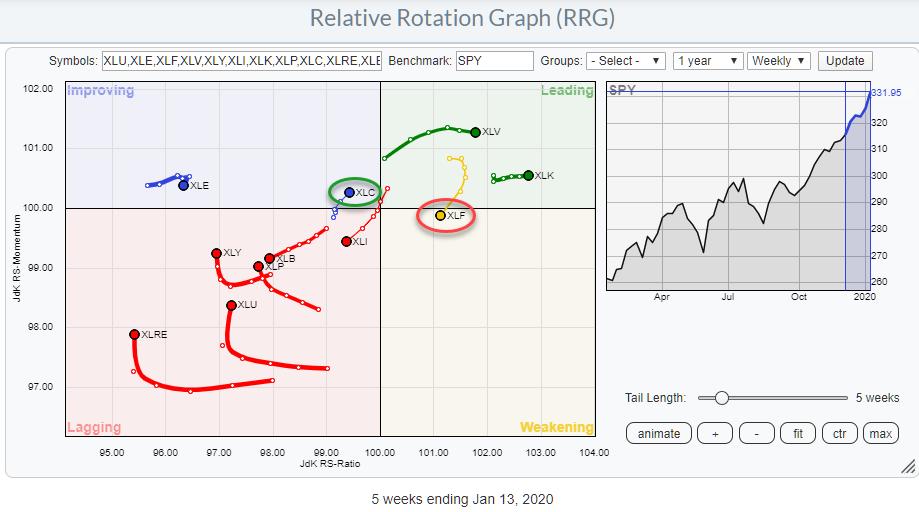
Here's a quick update for a rotation that caught my attention this morning. Since the end of last year, XLF has started to give up on its leading role. JdK RS-Momentum started to decline and the tail began to roll over... Read More
RRG Charts January 13, 2020 at 08:56 AM

In my last article for the Don't Ignore This Chart blog, which I write for on Thursdays, I wrote about the clear message that the rotation of Growth vs. Value is currently sending... Read More
RRG Charts January 07, 2020 at 06:53 PM

In this edition of StockCharts TV's Sector Spotlight, I take a look at new monthly charts and asset allocation. Afterwards, I build more on the Seasonality visualization and interpretation that I started during last month. This video originally aired on January 7th, 2020... Read More