RRG Charts April 28, 2020 at 01:27 PM

On this episode of Sector Spotlight, I begin with a quick overview of what happened with asset classes and sectors in the markets last week... Read More
RRG Charts April 23, 2020 at 05:39 AM
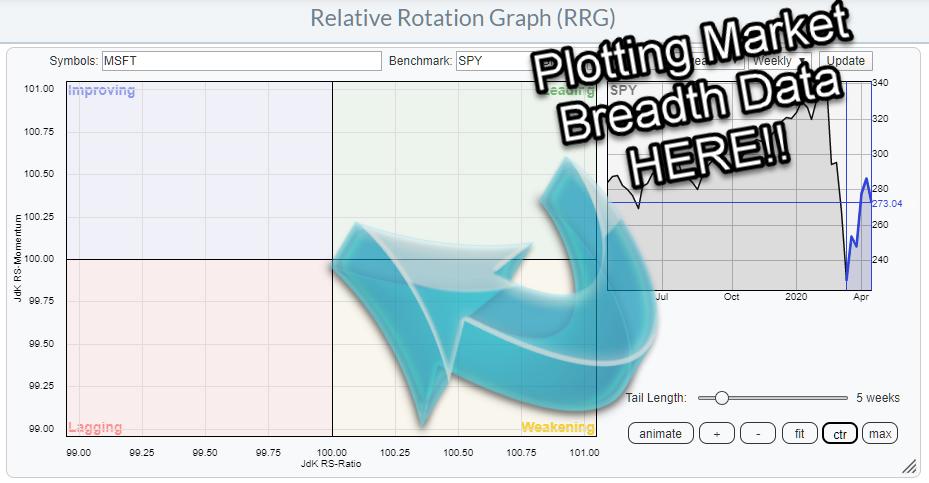
In the 4/14/20 episode of my show Sector Spotlight, which airs every Tuesday at 10:30am ET on StockCharts TV, I talked about plotting breadth data on a Relative Rotation Graph. The link below starts at that segment... Read More
RRG Charts April 21, 2020 at 02:04 PM

On this episode of Sector Spotlight, I perform an in-depth overview of asset class rotations, finding that RRG still suggests a cautious approach for stocks; meanwhile, (long) bonds are on the verge of breaking higher, sending yields to even lower levels... Read More
RRG Charts April 15, 2020 at 05:38 PM
Relative Rotation Graphs can show many different relationships. They do not necessarily have to come from regular price data-series like stocks or indexes. In my weekly show on Stockcharts TV, Sector Spotlight, which airs every Tuesday from 10.30-11... Read More
RRG Charts April 14, 2020 at 01:17 PM

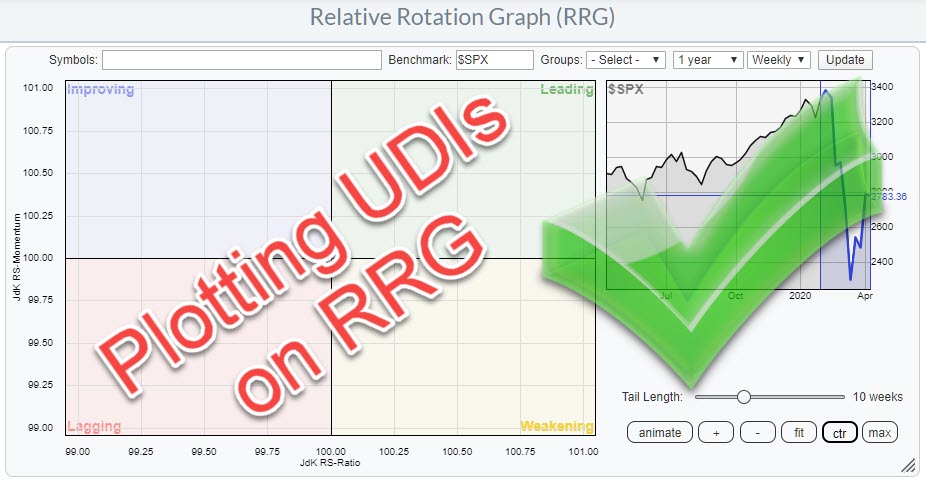
On this episode of Sector Spotlight, I demonstrate how you can create UDIs to plot pairs, as well as how to use breadth data for sectors on RRG. In addition, I also showcase a new idea for a pair trade. This video was originally broadcast on April 14th, 2020... Read More
RRG Charts April 08, 2020 at 09:12 AM
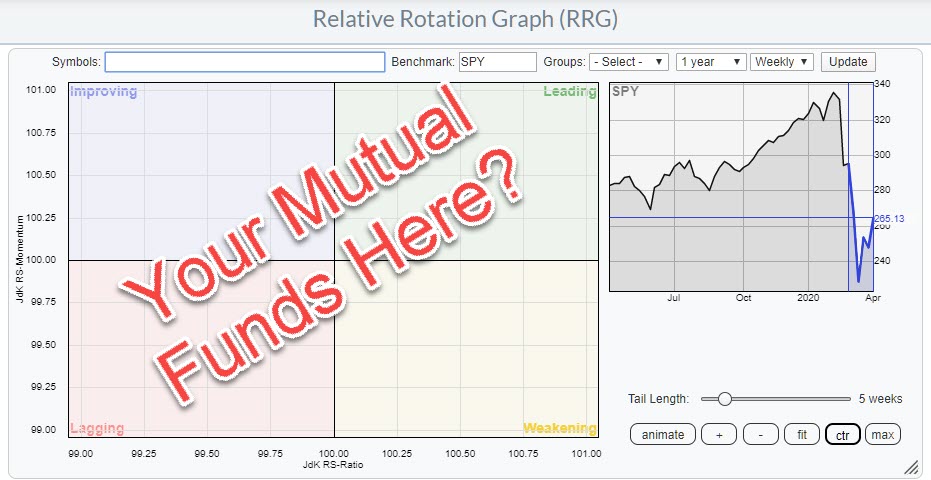
Recently I received a message asking if Relative Rotation Graphs would be useful for tracking Mutual Funds. My answer: Of course they are! Pricing of Mutual Funds In essence, the prices of mutual funds are also the result of people buying and selling on financial (stock) markets... Read More
RRG Charts April 07, 2020 at 01:45 PM

On this episode of Sector Spotlight, I take a look at sector rotation on monthly charts (since it is the first Tuesday of the month). In addition, I answer a question whether RRG can be used to monitor mutual funds. This video was originally recorded on April 7th, 2020... Read More
RRG Charts April 01, 2020 at 04:55 PM
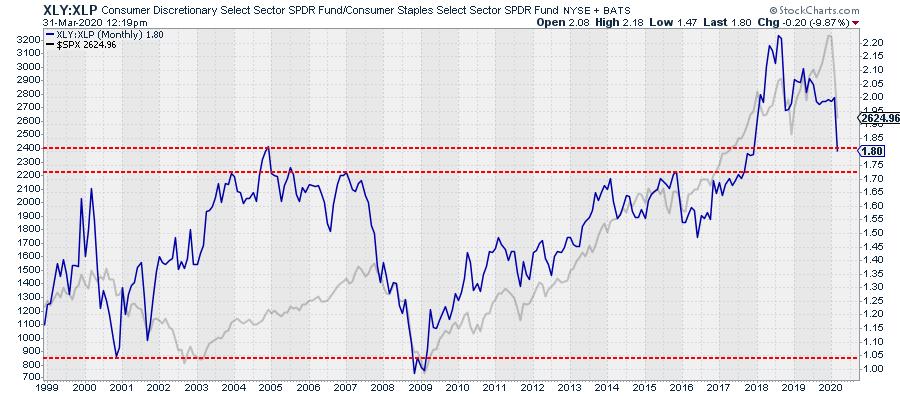
The ratio between XLY:XLP, Consumer Staples vs. Consumer Discretionary, has traditionally been a pretty good gauge to get an idea about being in a risk-on or risk-off environment. The chart above shows the XLY:XLP ratio, with the S&P 500 plotted behind it... Read More