RRG Charts July 27, 2022 at 03:34 PM
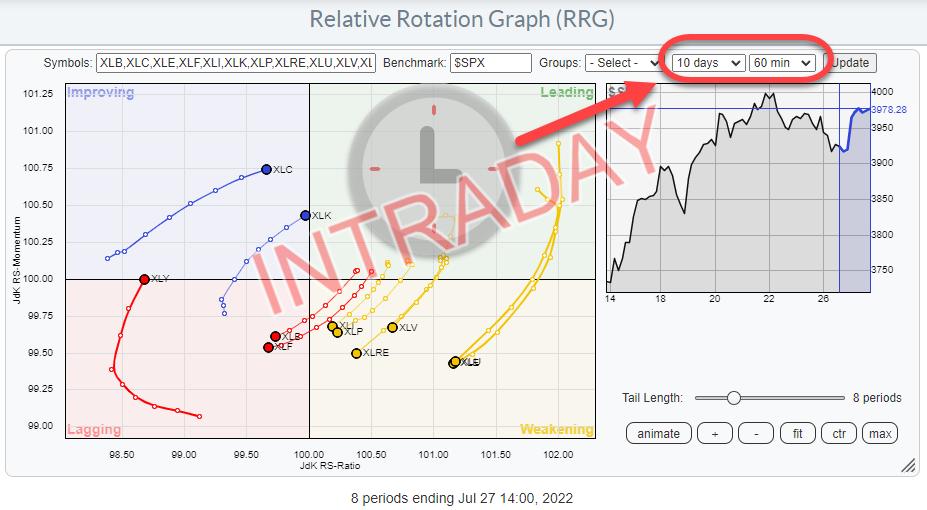
Relative Rotation Graphs (RRG) were introduced on StockCharts.com in July 2014. Since then, we have had the possibility to render the charts using weekly or daily data... Read More
RRG Charts July 26, 2022 at 11:31 AM

This edition of StockCharts TV's Sector Spotlight marks an important milestone in the life of RRG on StockCharts.com... Read More
RRG Charts July 21, 2022 at 05:31 PM
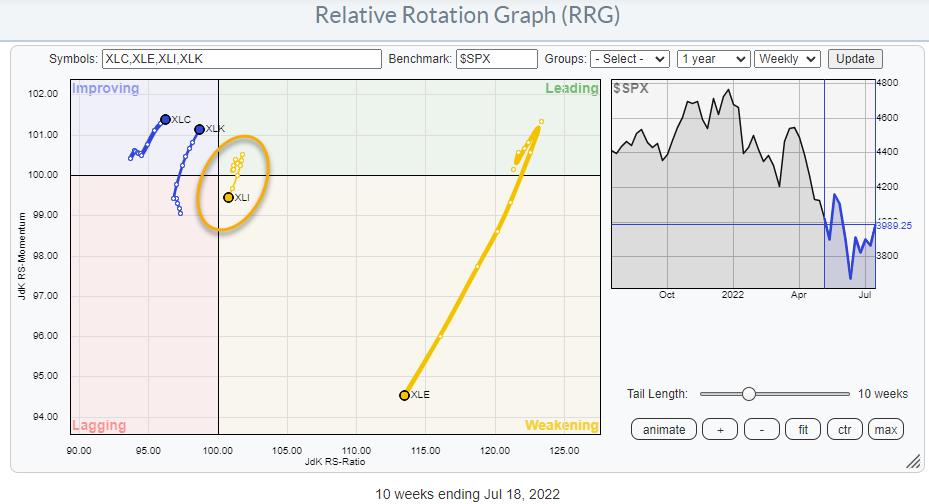
In this article, I'd like to dig a bit deeper into the Industrial sector. Starting at the sector level, we find the tail for XLI inside the weakening quadrant and moving towards lagging. So definitely not one of the better sectors... Read More
RRG Charts July 19, 2022 at 11:30 AM
In this edition of StockCharts TV's Sector Spotlight, I assess the current rotation in asset classes and sectors, highlighting the rotation for commodities, which are going through a setback but are likely to come back as the leading asset class... Read More
RRG Charts July 18, 2022 at 01:59 PM
Those of you who regularly watch Sector Spotlight on StockchartsTV will know that I have a few segments that come back on a regular basis... Read More
RRG Charts July 12, 2022 at 01:39 PM
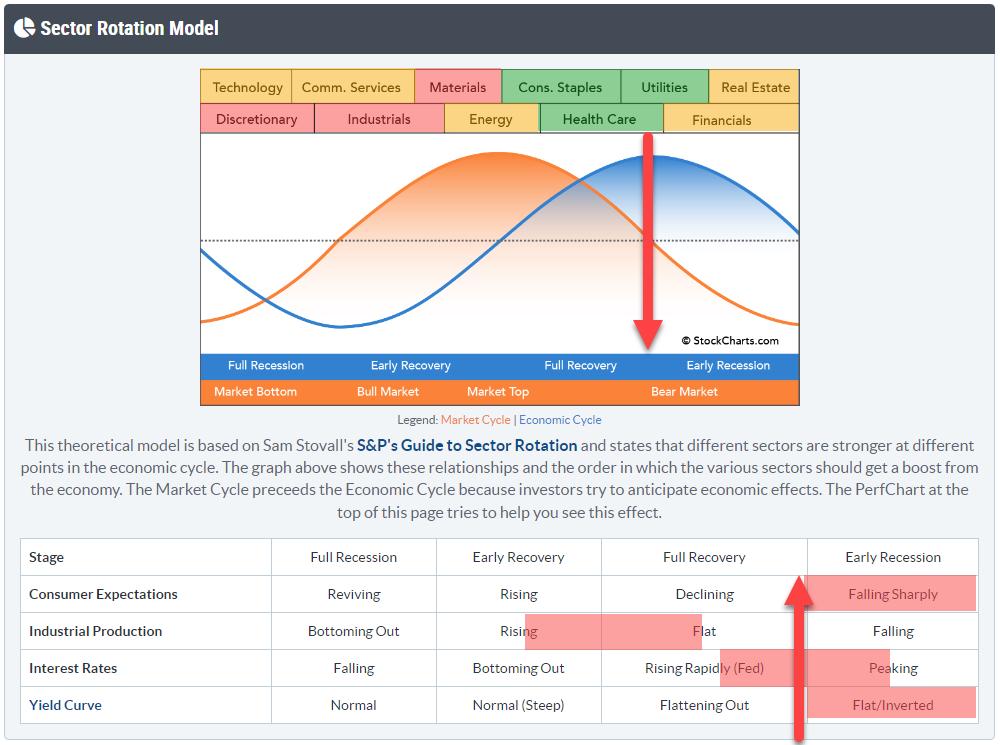
In this edition of StockCharts TV's Sector Spotlight, after an update on the current rotations for various asset classes, I look at the sector rotation model and and try to make an assessment on where, and which phase, we currently are in the market cycle... Read More
RRG Charts July 08, 2022 at 12:57 PM
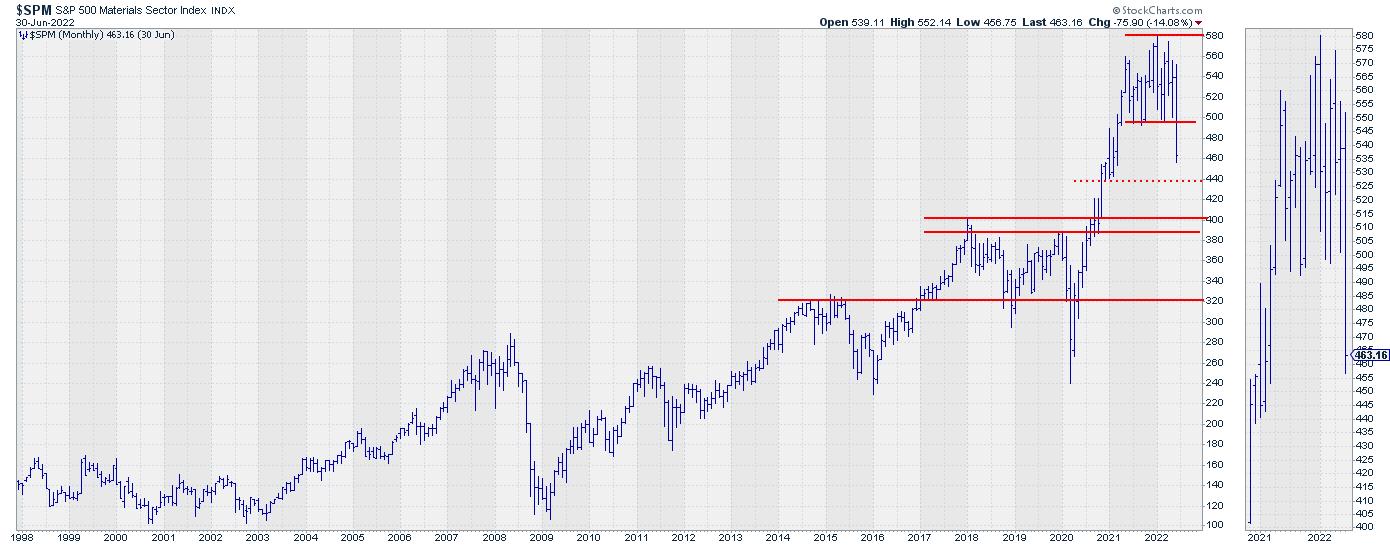
The chart above is the monthly chart for the materials sector $SPM, which I discussed in this week's episode of Sector Spotlight while going through the completed monthly charts for June... Read More
RRG Charts July 05, 2022 at 11:33 AM
In this edition of StockCharts TV's Sector Spotlight, to kick off the month of July, I dive into the status of the long-term trends as they are unfolding on the monthly charts... Read More
RRG Charts July 01, 2022 at 05:19 PM

The Financial sector qualifies as an offensive, or cyclical, sector, together with Consumer Discretionary, Real-Estate and Materials. On the Relative Rotation Graph for sectors, XLF is showing up inside the lagging quadrant, signaling a relative downtrend vs. the benchmark (SPY)... Read More