RRG Charts January 31, 2023 at 01:20 PM

In this episode of StockCharts TV's Sector Spotlight, I address the current state of asset class rotation, then move on to sector rotation... Read More
RRG Charts January 27, 2023 at 05:13 PM
In this week's episode of Sector Spotlight, I looked at market breadth using two different variations of Relative Rotation Graphs... Read More
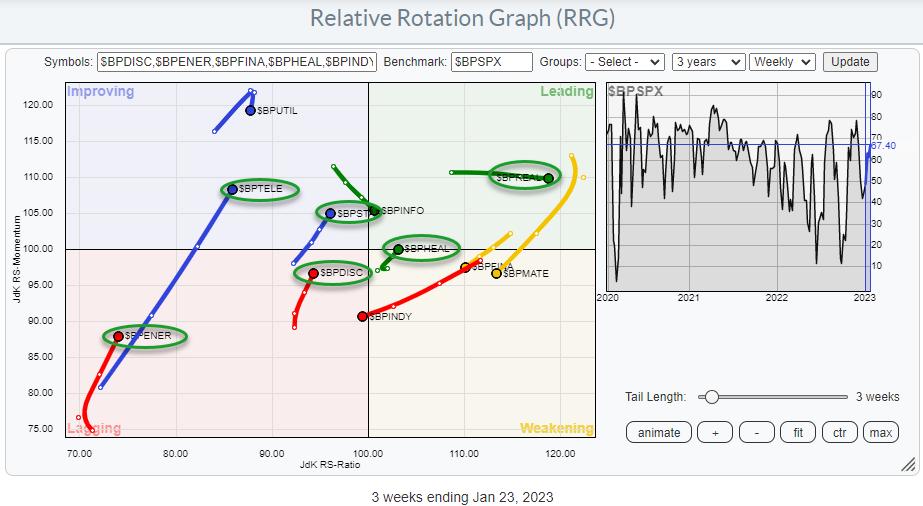
RRG Charts January 24, 2023 at 01:31 PM
After a 50% decline, you need to make a 100% return to break even. That is precisely what happened to the Communication Services sector... Read More
RRG Charts January 17, 2023 at 12:58 PM
In this episode of StockCharts TV's Sector Spotlight, I look at the current state of sector rotation, then walk through all 11 sector charts to make an assessment on their individual (relative) trends and their near-term support and resistance levels... Read More
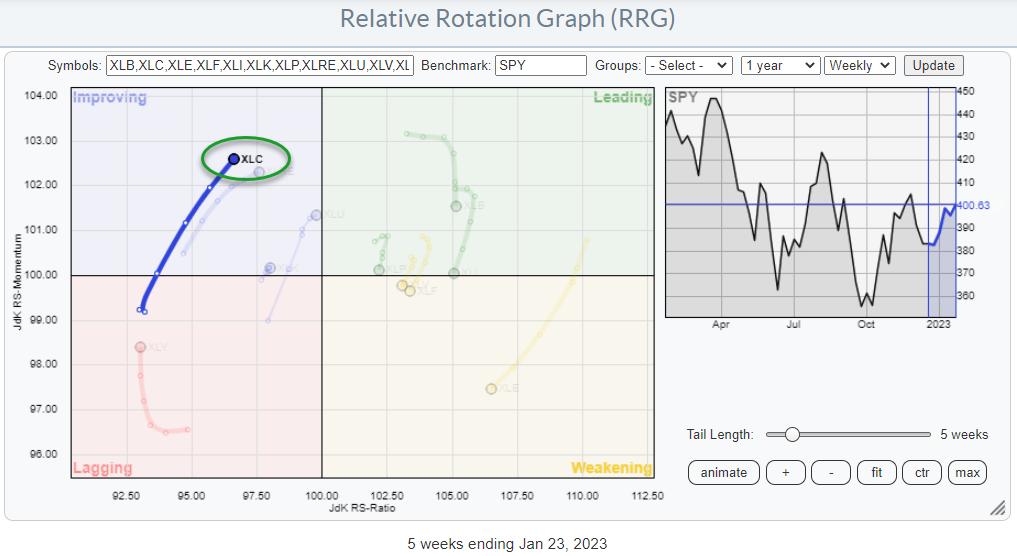
RRG Charts January 13, 2023 at 05:10 PM
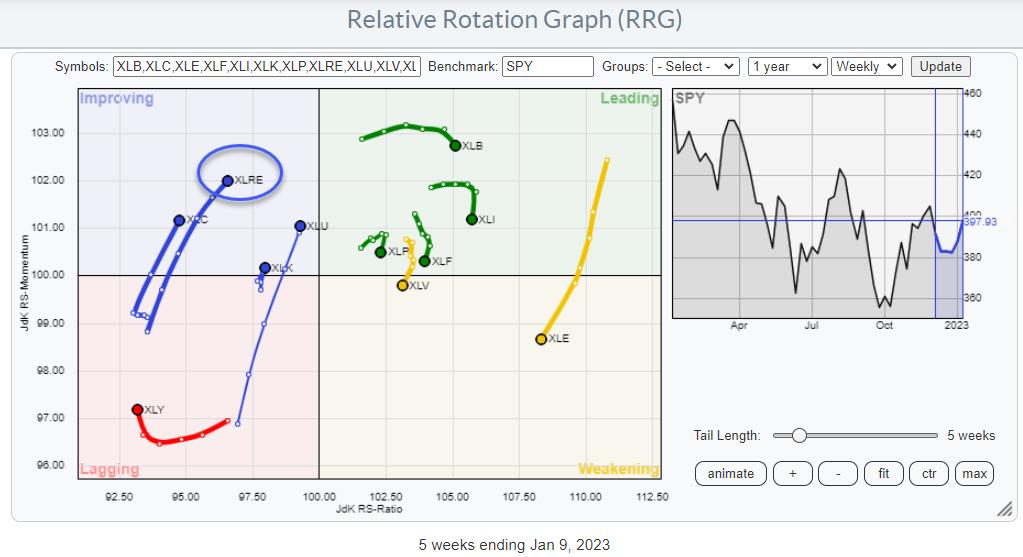
On the Relative Rotation Graph for US sectors, the tail for XLRE, the Real Estate Select Sector Fund, is inside the improving quadrant and heading towards leading at a positive RRG-Heading. This is one of the few tails with a positive RRG-Heading, between 0-90 degrees... Read More
RRG Charts January 10, 2023 at 01:00 PM
In this year's first episode of StockCharts TV's Sector Spotlight, I take a look at the Sector Rotation Model and address the current state of stock market sector rotation... Read More
RRG Charts January 06, 2023 at 05:38 PM
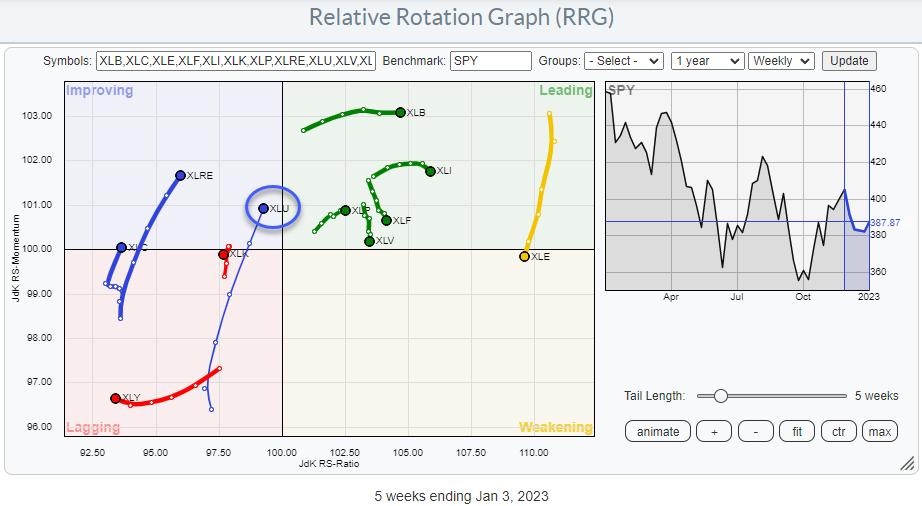
From the Sector Level On the Relative Rotation Graph for US sectors, the tail for the Utilities sector stands out. It is relatively long compared to the other tails on the graph, which indicates that there is quite a bit of power behind the move... Read More
RRG Charts January 03, 2023 at 01:21 PM
In this year's first episode of StockCharts TV's Sector Spotlight, I address the expected seasonal performance for the stock market and the individual sectors... Read More