
Monitoring purposes SPX: Sold SPX on 4/1/14 at 1885.52 = gain 1.78%; Long SPX on 3/26/14 at 1852.56.
Monitoring purposes GOLD: Gold ETF GLD long at 173.59 on 9/21/11
Long Term Trend monitor purposes: Flat
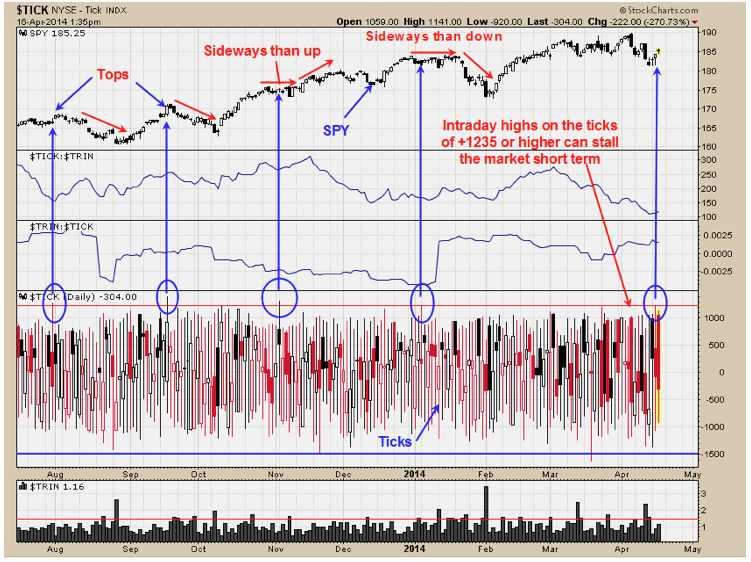
Tomorrow is the last trading of this week and again option expiration week had a bullish bias. The chart above is a chart of the intraday high and low of the NYSE tick readings. Intraday tick readings near +1235 and above have lead to short term exhaustion moves in the SPY.
Going back to August of last year, we have labeled the intraday high of the ticks with blue arrows when the ticks had intraday highs greater than +1235. Two cases in late July and mid September the spy was near a high. The November period marked a point where the market stalled several days than moved higher. The case in January stalled the market for a couple of weeks than decline into a February low. Since the a three day weekend is coming up the volume most likely will be lighter tomorrow than today and with yesterday’s upticks reaching +1235 (suggests short term exhaustion) the upside is limited. Yesterday we noted a possible rise to the previous high of early April if the SPY pushed through the 184 range. Now we don’t think that condition is in the cards. With yesterday’s ticks readings extreme and preholiday light volume tomorrow, a stalled market is likely here.. Staying neutral for now.
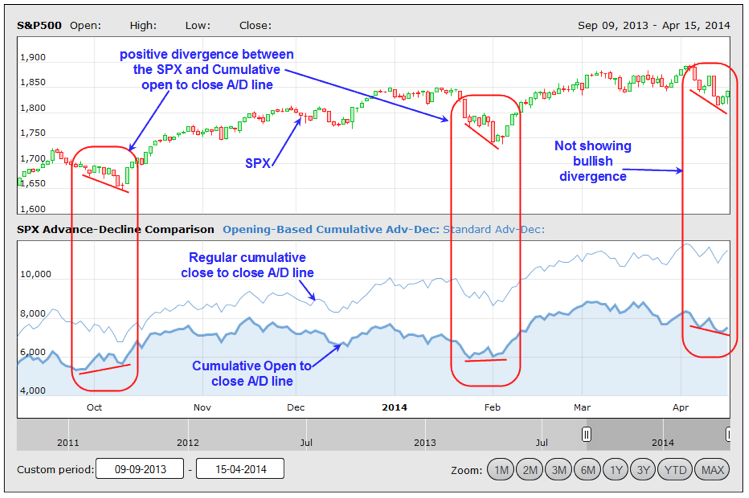
The chart above is provided by www.markettells.com. The top window is the SPX chart and the bottom window is the Open to Close Cumulative advance/decline line (bold blue line). The light blue line is the regular cumulative advance/decline line. The last two decent declines in the SPY (the October and February bottoms) produced a positive divergence in the in the Open to Close Cumulative Advance/Decline line where the regular cumulative advance/decline did not. The last low in the SPX (last Friday’s low) did not produce a bullish divergence in the open to close cumulative advance/decline line and one may form when a true low in the SPX is found. Previously we had a downside target on the SPX near 1790 range which is still a possible target and the current run higher may be short lived. With the volume most likely dropping tomorrow (market are closed Good Friday) for a three day weekend, a short term high could be reached tomorrow.
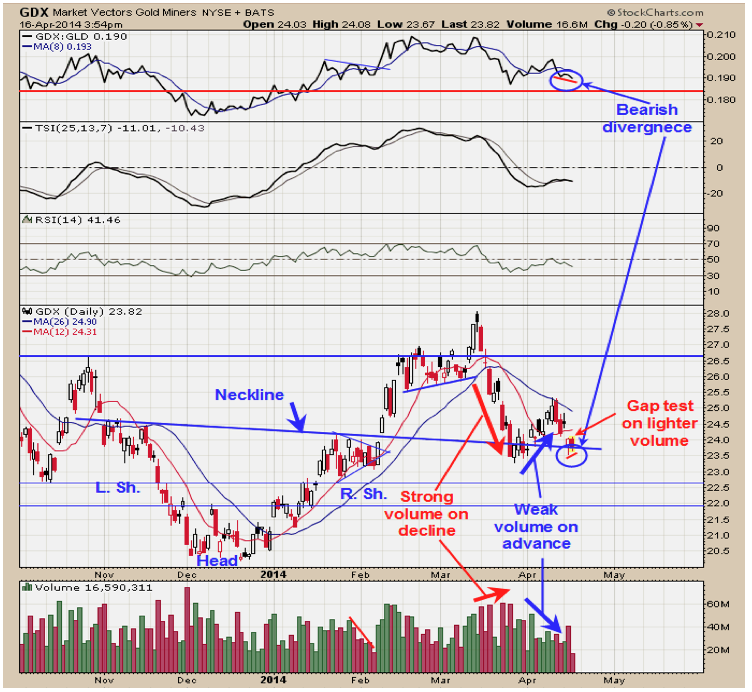
Though the bigger picture on Gold and Gold stocks looking promising the short term picture doesn’t look so good. There is a cycle low due in July and between now and than along with poor Seasonality, gold and gold stocks could have a trying time. The very short term picture is above. The decline off of the high in mid March came on high volume (high volume usually goes in the direction of the trend). The rally off of the late March low came on decreasing volume and another bearish sign. Yesterday GDX gap down on high volume and today that gap was tested on lighter volume. Light volume test of a gap shows the gap has resistance. Today GDX made a higher low than yesterday and the GDX/GLD ratio made a lower low and a short term negative divergence. There a Neckline line support of a head and Shoulders bottom but with negative volume studies and bearish divergence in the GDX/GLD ratio would suggest the Neckline support may not hold.