
Technical patterns for Dark Pools often reveal the potential for a sudden huge gap or long white candle run caused by High Frequency Trading or HFT activity. HFT price action typically follows Dark Pool quiet accumulation, so it is important to study Dark Pool patterns in a stock chart, which are different than most traders expect to see.
The Dark Pool activity is most often from either a giant mutual fund or big blue chip company pension fund. These colossal long term fiduciary investors buy millions of shares of stock over an extended period of time, using specialized automated orders designed specifically for their needs.
The Dark Pools are off-the-exchange platforms called Alternative Trading Systems that cater to these large fund managers’ requirements for order execution. The most important and most influential funds do not want to disturb price as they buy incrementally over several weeks to several months’ time, acquiring a lot of stock for their fund holders. These funds have moved to the Dark and Twilight Pools to avoid front-running by the HFTs. However, they have no concern about HFTs buying in AFTER they have accumulated what they want.
The technical trader can use the Dark Pool technical patterns that form due to their precision entries that control price in a particular pattern, easily seen on stock charts.
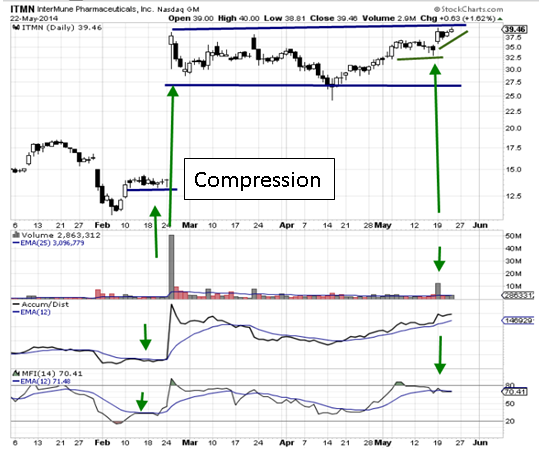
In the chart below, ITMN had a Dark Pool “compression pattern” just prior to the huge gap up in February by HFT pre-market order flow. HFTs discover Dark Pool buying or news about a company that the Dark Pools already know. This triggers the computer generated orders of HFTs. Study of the candlestick pattern developing, volume and accumulation indicators are needed to confirm that Dark Pools are present and that this very tight price action is a result of their intermittent yet consistent buying over time.
The gap was huge and it took time to pattern out the excessive speculation in the stock. However, the gap did not fill since this is a breakaway gap. After the gap, a consistency in the price pattern, volume, and accumulation indicators continues that is consistent with large lot institutions buying in incrementally again.
A compression pattern often precedes another HFT action.
In order for technical traders to take advantage of HFT-driven gaps and runs, learning to interpret pure price candlesticks with volume and accumulation indicator patterns and time factors are essential for success. The entry requires that the technical trader identify the Dark Pool pattern before the move, as most HFT activity results in gaps or long white candles that run up in the first 5-10 minutes of the trading day.
The combination of the price compression and indicator confirmation is the signal for entry. A controlled bracketed order, using buy-into-strength types of orders, reduces risk of whipsaw action in the event the trader is not calculating the time factor properly. Stocks tend to move sideways during the large lot accumulation phase for set periods of time after a huge gap.
Summary:
Opportunities for technical traders to exploit HFT action are present in the charts. It is a matter of recognizing the subtle price action of the Dark Pools and understanding how, when, where, and why they are accumulating OR distributing or rotating. When the patterns are identified, the trader has time to prepare, plan, and calculate the best entry.
Limit orders should never be used for these types of entries. Remember, the professional technical traders no longer use limit orders due to risk factors caused by HFT action.
Trade wisely,
Martha Stokes CMT
www.TechniTrader.com
info@technitrader.com