
This week, let’s study colored Volume Bars and how to avoid whipsaw trade risk by understanding how volume and volume-based indicators reveal the weakness in a candlestick pattern.
Many traders still rely upon price and price indicators solely, which leaves them highly vulnerable to whipsaw action. Volume is critical in today’s automated marketplace where 80% of all orders are processed automatically via a computer program set to fill large orders over time without moving price.
On the VAC chart below, the current day is an Engulfing White (aka Bullish Engulfing) candlestick pattern, which is commonly used for entries. Prior to that candle forming, the stock had two reversal candle patterns where sellers attempted to sell the stock down, but buyers moved in, triggered by the support from the highs of late December. This is a technical bounce area for this stock. Professional technical traders are active at this time, and some retail traders may also be in the stock. This is not a fundamental support level and there is no Dark Pool Footprint, which is a very distinct price and accumulation pattern.
On the day of the Engulfing White, volume is dropping. A moving average on volume bars makes this easier to see. It is a warning that this stock lacks sufficient buyers. In addition, CMF is on the distribution side as price moves up, which is a divergence pattern indicating a giant or large lot fund is rotating slowly and carefully out of this stock without affecting the price. The Large lots are selling while smaller lots are buying. This weighs the balance of power to the downside.
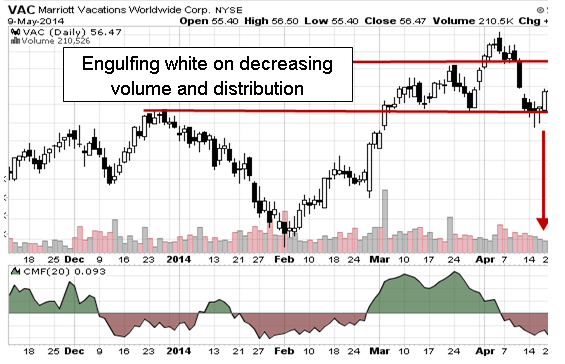
In early March in the chart above as well, a common gap up to a long white candle with an extraordinarily long volume bar is the footprint of High Frequency Trading orders. The stock did not move up strongly after that HFT action because volume was weaker.
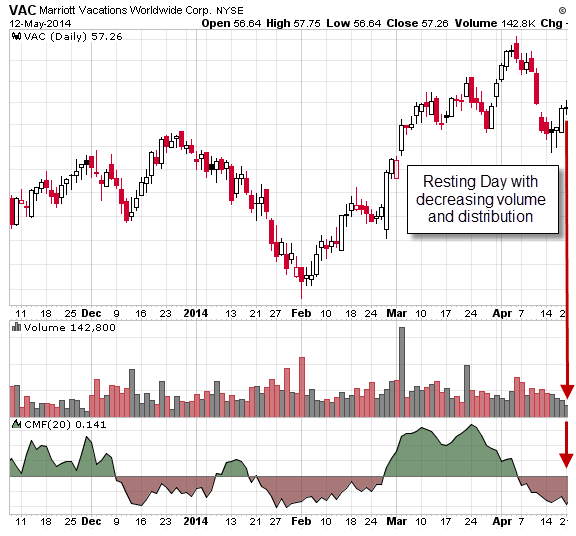
The next day, the stock forms an indecision candle pattern, as seen in the chart below, rising slightly above the previous high and settling back to the close with much lower volume.
The next day, in the chart below, the stock moves up about 1 point on rising volume but with more rotation showing in Red CMF. The stock moves up to the weak resistance level and pulls back before the close of the day. Volume is still below its average.
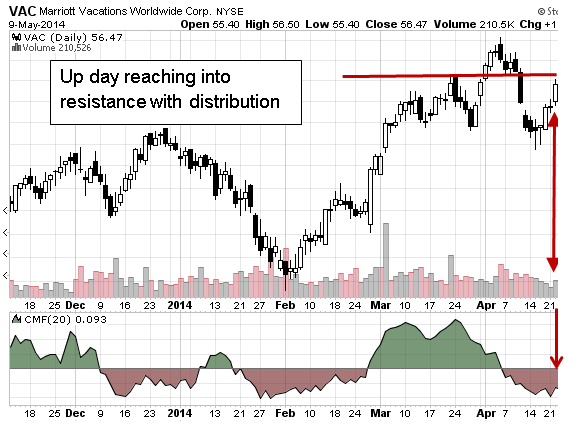
At this point, the retail trader has less than one point gain, which is insufficient for a swing trader to be profitable when all the costs of the transaction, time, fees, etc. are factored in. However, since the stock moved up, greed settles in. Most swing traders would hold, unaware that volume is insufficient to drive price up, that the resistance just above is more substantial than it appears due to the weaker volume AND due to the sell side pressure of larger funds rotating out as price moves up. But most retail swing traders would be excited and would choose to hold.
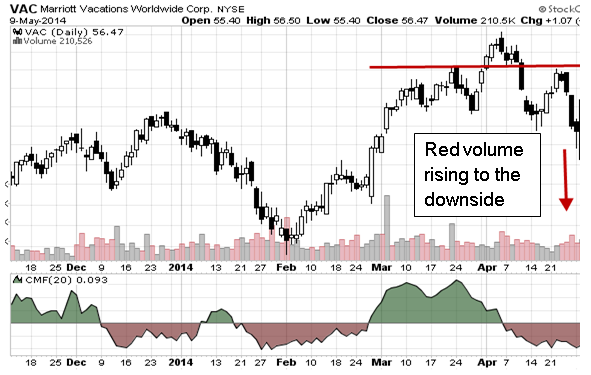
Here is what happened next: The first small black candle in the chart below wipes out half of the tiny profit. This tends to make retail traders try to hold, hoping the next day the stock will move up again as it did before. Sure enough, the stock opens at the prior close but then falls further that day. The following black candle wipes out all the remaining profits. Most swing traders trade runs for 2-10 days. But look at volume. Red Volume is rising. The larger lots are taking control as fewer small lot buyers are moving in. The following day is a huge down day with a 2-point loss. Exiting the following day either means a 3-point loss or contains the loss to about 2 points. The risk to reward ratio was inverted, the large lots were selling into the bounce, and smaller lot traders had a whipsaw trade.
This is why most retail traders have chronic losses with intermittent profitable trades. Volume and volume-based indicators are critical. Not using volume means you have no idea which side of the transaction the larger lots are trading.
Some retail traders would argue that they would have gotten out of the trade on the first day, or the second day, but in reality most do not. Also, if you are taking 25 cents off the table and thinking you are profitable, think again. With fees, costs, and your TIME, you are losing money or breaking even. How much is your time worth? Minimum wage? Calculate the time you are spending including your time going to seminars, webinars, and searching the internet for answers. Then, add it all up. Most retail traders are losing money by setting their profit expectations too low.
Trade wisely,
Martha Stokes, CMT
www.TechniTrader.com
info@technitrader.com
888-846-5577