
At any one time in any stock there can be as many as 4 different orders:
Buy orders with the intent that the stock will move up.
Sell orders, either profit-taking or due to a loss.
Sell short, selling borrowed stocks with the intent for the stock to move down in price.
Buy-to-cover, either for profit or due to a loss.
Stocks move with velocity when one or two of these components control price, shifting the balance of power to one side or the other.
Buy-to-Cover candlestick patterns are often overlooked or not recognized by most retail traders. These patterns are not taught in the traditional candlestick books, articles, or webinars on Japanese candlestick patterns. However, recognizing when Buy-to-Cover candles form is crucial to determining how far a stock will move down during a correction or bear market.
Buy-to-Cover action can cause problems for traders who are shorting the stock, options traders who are buying puts, and traders or investors who reach the emotional level of capitulation.
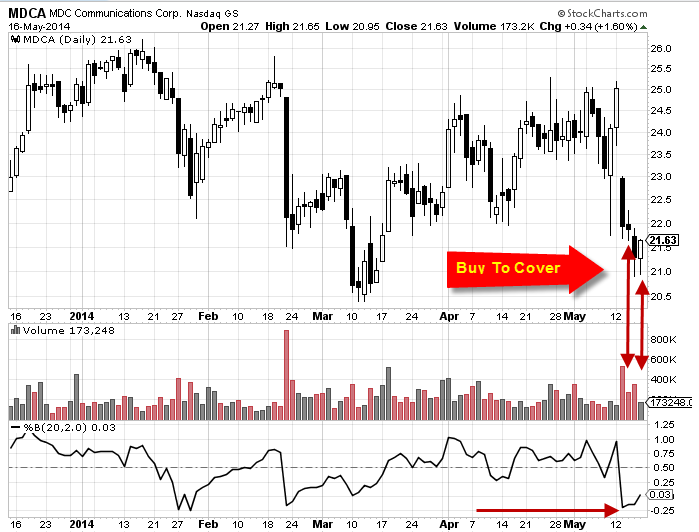
The chart below shows 2 different types of Buy-to-Cover price action. Buy-to-Cover orders occur as professional traders and others who were in a sell short position decide to cover their shorts or take profits. These patterns often take retail traders by surprise and can cause whipsaw trades in sell short positions. And they are often misinterpreted as resting day patterns.
Buy-to-Cover candlestick patterns differ from Buy-on-the-Dip candlestick patterns and Bargain Hunting quiet accumulation candlestick patterns.
Buy-to-Cover orders are used strictly by traders who had been selling short but decided to close the position.
Buy-on-the-Dip traders and investors typically are less informed and have limited education and experience. The Buy-on-the-Dip candlestick pattern is often a small gap down price action and often can have long wicks and tails on the candles as well.
Bargain Hunter quiet accumulation is a totally different candlestick pattern. These are giant lot investors buying based on fundamental data. Bargain hunters tend to buy as a stock enters or goes slightly beyond the support levels of a prior sideways action.
Buy-to-Cover traders will tend to exit before a stock enters the support level, as professional sell shorters are keenly aware of the invisible Dark Pool Giant-Lot investors who can move in as a stock
drops into their buy zone from prior months. Therefore, most Buy-to-Cover patterns form above the support level by a small amount.
By contrast, Buy-on-the-Dip patterns tend to occur at weaker support levels prior to a stock moving down further.
Buy-to-Cover price action seldom reverses the trend by itself. There must also be Bargain Hunters or sufficient numbers of Buy-on-the-Dip smaller-lot investors to move price up.
As always, volume is integral to distinguishing which market participant groups are creating the price patterns at that time.
Learning to identify Buy-to-Cover, Bargain Hunter, and Buy-on-the-Dip candlestick patterns gives technical traders a more in-depth and detailed understanding of which of the 9 market participant groups is controlling price at that time which, in turn, tells you what to expect next from near-term price action.
Trade wisely,
Martha Stokes, CMT
www.TechniTrader.com