
Monitoring purposes SPX: Sold SPX on 4/1/14 at 1885.52 = gain 1.78%; Long SPX on 3/26/14 at 1852.56.
Monitoring purposes GOLD: Gold ETF GLD long at 173.59 on 9/21/11
Long Term Trend monitor purposes: Flat
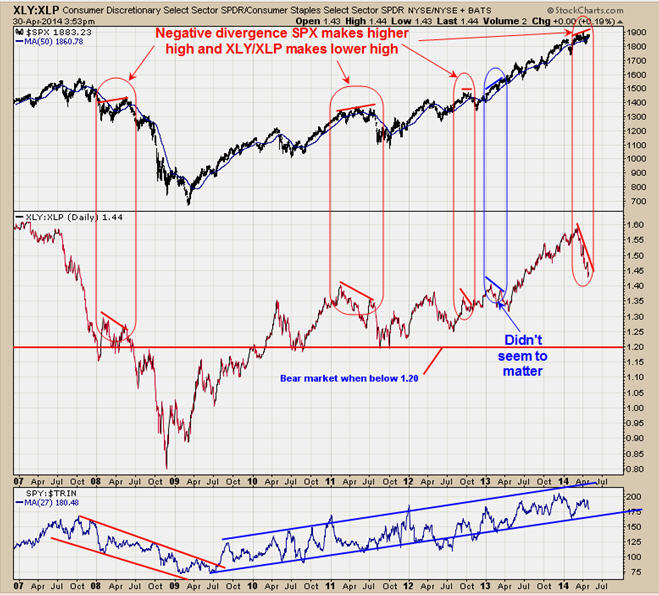
Rennie Yang of www.marketells.com pointed out the above divergence in his latest report. He said, “XLY/XLP ratio – consumer discretionary stocks traditionally outperform consumer staples in bull markets. Over the last two months, this ratio has been on a straight-down path.” I went back and pointed out the divergences in the past where XLY/XLP ratio was making lower highs as SPX has making higher highs and has worked well. We don’t have a buy signal here and the market has pushed modestly higher and into the resistance area of the 187 – 188 level where the Equity put/call ratio (CPCE) was less than <.50. (See reports of 4/22, 23 and 24.) There appears a pull back be in the making but should hold above 181 level on the SPY in a worst case scenario.

The FOMC announcement came and gone and did little to market behavior. What comes next is Employment release on Friday 5/2 which may be what the market is waiting for.
We are dealing with the pattern that has been forming since early March. We have pointed out with red arrows where high volume days occurred that have not been tested and we are heading for the 4/4 high volume day located at 189.70. If the 4/4 high is tested on lighter volume, than that condition will imply resistance and could end up with a sell signal. Notice that today’s volume was higher than the two minor highs of mid April and suggests the SPY should move higher and will most likely test the 4/4 high. If a bearish signal is triggered near the 4/4 high (190 range on the SPY) than the downside targets will be either the 4/28 high volume low near 184 or the 4/11 high volume low near 181. Both of these lows had high volume and never tested and suggests at some point there will be tested again. Staying neutral for now.
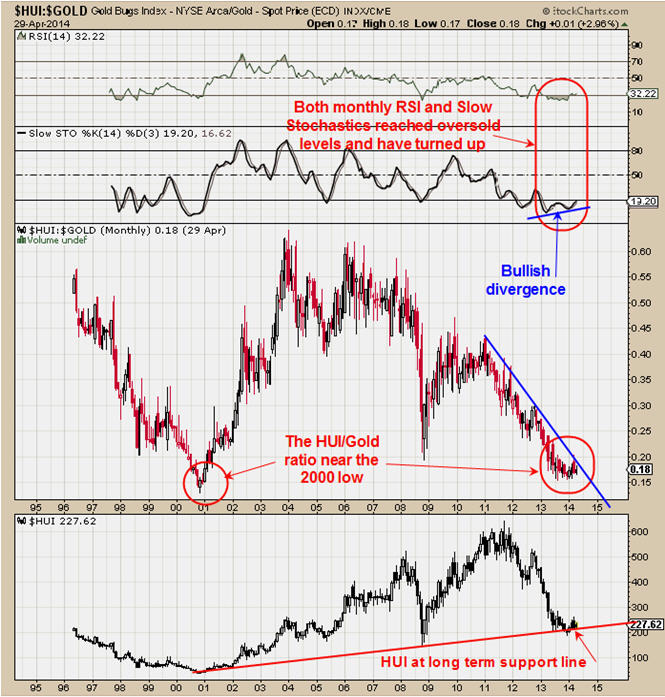
This is a long term view of the monthly HUI/Gold ratio. The HUI/Gold ratio is a good way to find value in gold stocks. When the HUI/Gold ratio is low than gold stocks are considered cheap to the price of gold and when this ratio is high than gold stocks are overvalued compared to gold. The HUI/Gold ratio above goes back to 1996. At major lows in the past the HUI/Gold ratio got as low as .13 at the November 2000 bottom and at .195 at the November 2008 bottom. The more recent low reading in this ratio came at .1556 in August 2013 and has since moved sideways. Therefore the current HUI/Gold ratio reading is above the major low of 2000 and below the crash low of 2008 and in a very good valuation for gold stocks on a longer term view. The bottoms window is the monthly HUI gold index chart. We have drawn a trend line up from the 2000 bottom to the low of 2008 and it is coming in near current levels and suggest there is support in this region. The top window is the monthly RSI and it has reached below 30 and has turned up and a bullish sign. Next window down is the Slow Stochastics which also has reached oversold levels and produced a positive divergence and appears to be turning up. Seasonality doesn’t turn bullish for gold until June or July and market could drift until than but longer term this chart looks promising.
Tim Ord, Editor
16928 Van Dorn Street
Walton, Nebraska 68461
www.ord-oracle.com
(402) 486-0362.
tim@ord-oracle.com