
Monitoring purposes SPX: Short SPX on 5/19/14 at 1885.08.
Monitoring purposes GOLD: Gold ETF GLD long at 173.59 on 9/21/11
Long Term Trend monitor purposes: Flat
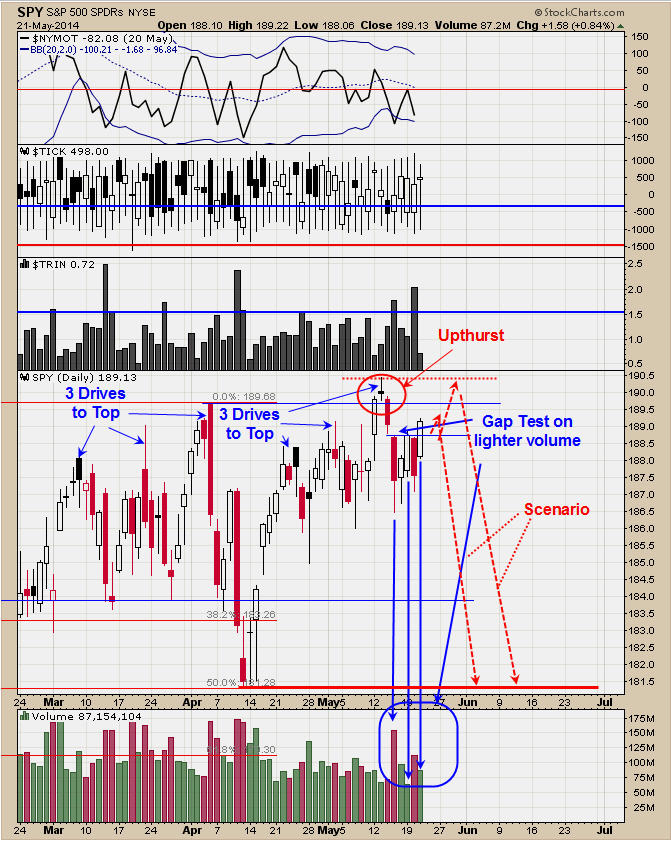
We had a short term target on the SPY near 189 range which is where a gap formed on 5/15. If this gap was tested on lighter volume (tested on 5/19 on much lighter volume) it would imply resistance and today the gap was tested again and still on lighter volume and implies resistance. This week trading leads into a three day weekend holiday and market tends to “hold up” going into a holiday weekend. Most likely volume will start to drop tomorrow and Friday as traders leave early for the three day weekend. Light volume rallies tend to be a bearish sign and if market does attempt to test the 5/13 high (1902.17 on SPX) it will likely be on much lighter volume. The pattern that has been forming since late April is a “Three Drives to Top” pattern and the third top was reached last Tuesday. Some times on a “Three Drives to Top” the third top is tested and leaves open the door on this go around. It looks as that a top is being formed here whether the last Tuesday’s high is tested or not. The reason we have a downside target to the April 11 low (near 1810 on the SPX) is that it was a high volume low and was never “Touched” on lighter volume to complete the bottom process. We are short the SPX at 1885.08 on 5/19/14.
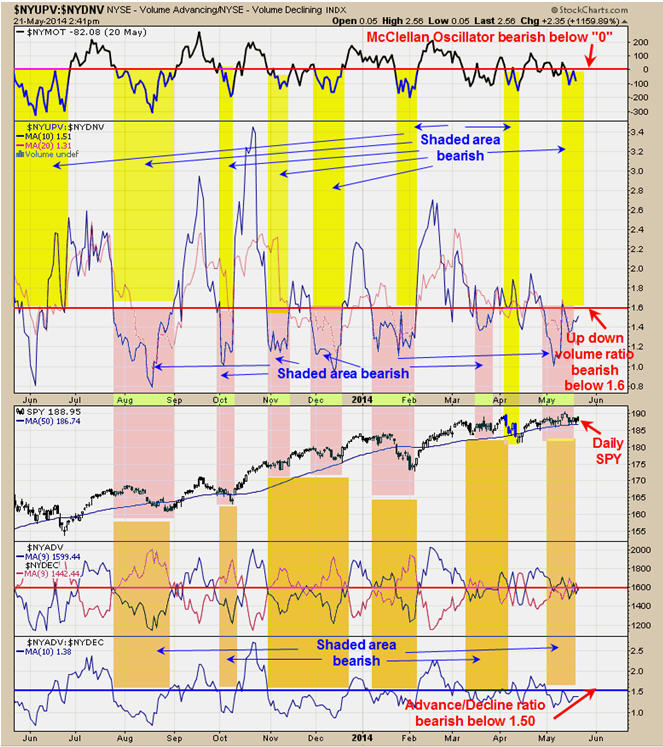
The indicators on the chart above help to define the trend of the market that has a “lookout” of a month or less. The shaded areas show when the assorted indicator is in bearish territory. The top window is the McClellan Oscillator and the yellow shadow represents the times when the Oscillator is below “0” and a bearish sign for the market. Next indictor down is the NYSE up volume and NYSE down Volume and the shaded area represent when this indicator is showing a bearish condition for the market. The bottom window is the NYSE advance/decline ratio and the shaded orange level show when this indicator is showing a bearish condition for the market. Next Monday is Memorial day and markets are closed. Its common for the market to form reversals on the day before a long weekend like the one coming up. Therefore the market could hold up the rest of this week and could possibly test last Tuesday high near at 1902.17.
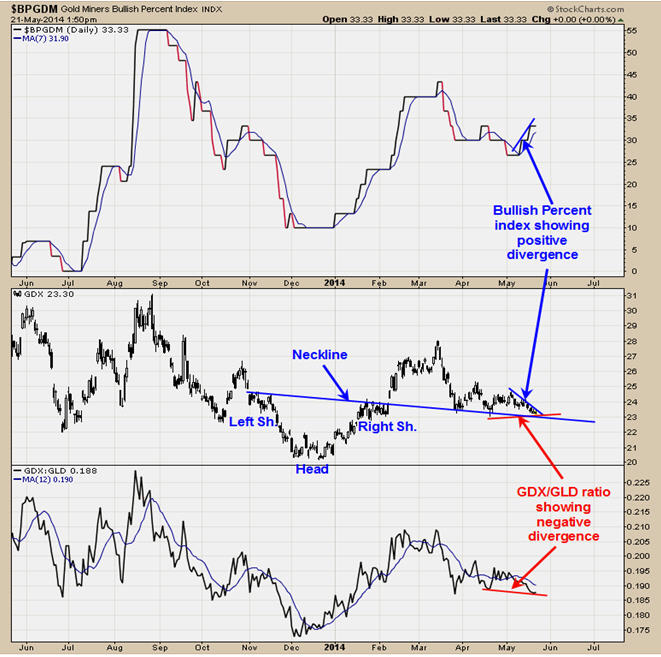
The top window is the bullish percent index for the Gold Miners. The bullish percent index measures the percent of buy signals using the Point and Figure method in the stocks that are in the Gold Miners index. The bullish Percent index has been rising since early May and currently stands at 33.33% of the stocks in the Gold Miners index are on point and figure buy signals. This condition is a positive divergence and a bullish sign for GDX. The bottom window is the GDX/GLD ratio. When this ratio is moving higher than that is a positive sign for both gold and gold stocks and vice versa. Since Mid April this ratio has made lower lows and GDX has made higher lows and a negative divergence. The Bullish Percent index is showing positive signs and the GDX/GLD ratio is showing negative signs and the stalemate continues. We are still waiting for clues of a good setup.
Tim Ord, Editor
16928 Van Dorn Street
Walton, Nebraska 68461
www.ord-oracle.com
(402) 486-0362.
tim@ord-oracle.com