
Monitoring purposes SPX: Sold SPX on 4/1/14 at 1885.52 = gain 1.78%; Long SPX on 3/26/14 at 1852.56.
Monitoring purposes GOLD: Gold ETF GLD long at 173.59 on 9/21/11
Long Term Trend monitor purposes: Flat
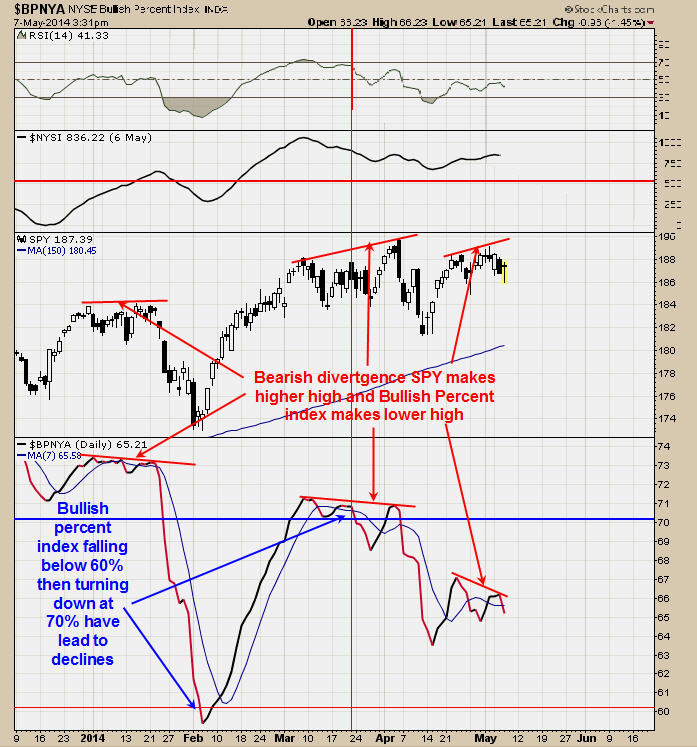
Above is the bullish percent index for the NYSE. The bullish percent index measures the percent of stocks in the NYSE that are on point and figure buy signals. It has been an intermediate term bearish sign when first the Bullish Percent index falls below the 60% level and than finds a cap on the next rally near 70% and turns down. This setup occurred back at the April high. There also has been bearish divergences where the SPY hits a higher high and the Bullish Percent index makes a lower high (see chart above). This type of setup occurred at the January and April highs and currently there is a third divergent in place. However, we believe there is one more new high to be made before the next pull back begins as shown on the chart below.
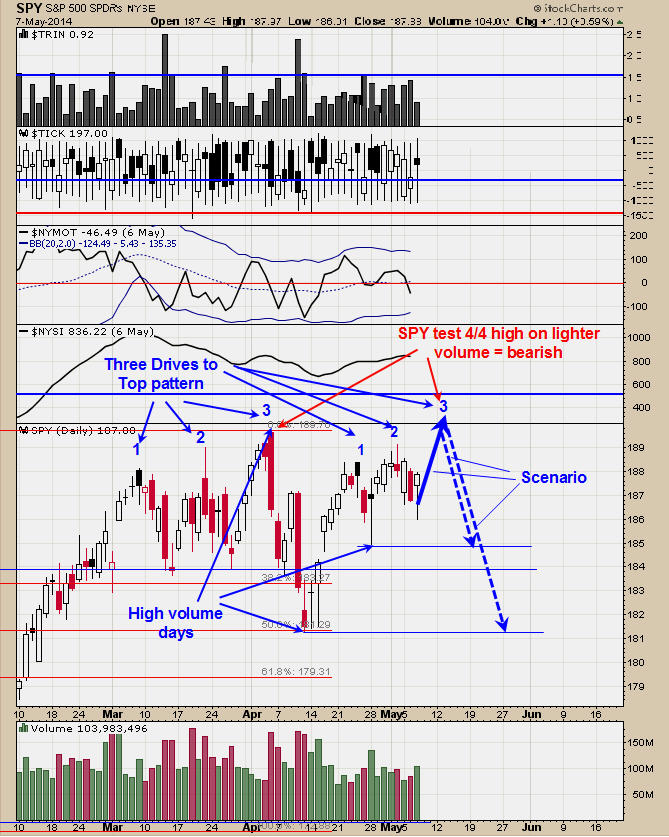
We have pointed out with blue arrows where high volume days occurred that have not been tested. We have found that most high volume days (either a high or low) are tested and if tested on higher volume will imply that direction will continue. However if a previous high volume day is tested on at least 10% lighter volume than that high volume day test will imply resistance and market may reverse. The pattern that appears to be forming here is a “Three Drives to Top” and the same pattern that appeared going into the April 4 high. The key to help identify a “Three Drives to Top” is forming is for the second top have higher volume than first top (check) and the retracement off of the second top be 61.8% or more (check). Normally the third top will be on lighter volume than the first and second top volume and something we will have to wait and see. The minimum downside target of a “Three drives to top” is where the pattern began an in this case would be near the 4/28 low of 185 but can go lower. Since the 4/11 high volume low was not tested on lighter volume we are favoring that low which comes in near 181. A potential sell signal could be triggered near the 190 level on the SPY. Staying neutral for now.
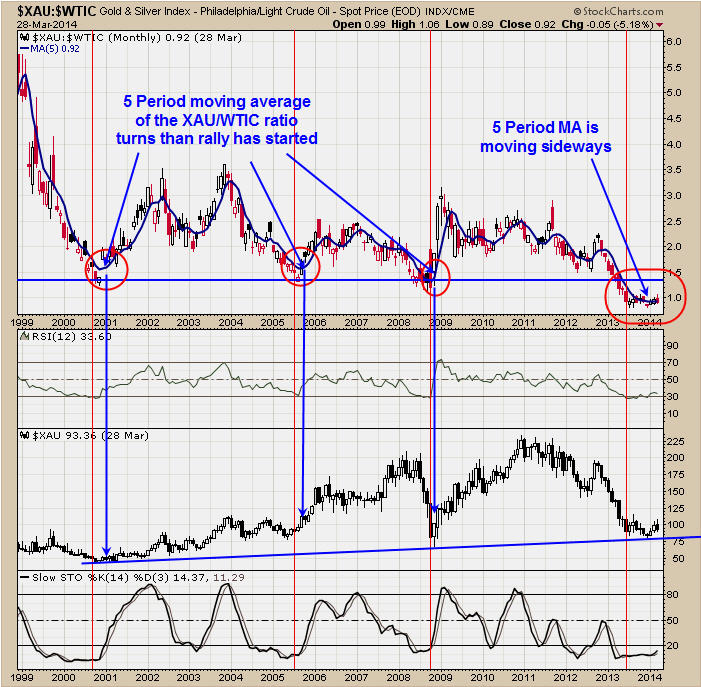
We showed the above chart yesterday but shrank the time down going back to 1999. On yesterday’s report we said. “The chart above is the monthly XAU/WTIC ratio and the RSI and Slow Stochastics is on the XAU/WTIC ratio. The XAU is a gold index and the WTIC symbol is for the Philadelphia Light Crude Oil. Long term bullish signals have been triggered for the XAU when the monthly RSI for the XAU/WTIC ratio turned up from below 30 and the monthly Slow Stochastic for the XAU/WTIC ratio turned up from below 20. We have marked these conditions with vertical red lines. Looking back this method picked out the bottoms of 2000; 2005; 2008 and a bullish signal were triggered back in mid 2013……. It does appear that the XAU rally starts when the XAU/WTIC ratio turns up and so far this ratio is trending sideways near 1.00.” We have noted with blue arrows when the 5 period moving average of the monthly XAU/WTIC ratio turned up and has been timely in identify the previous rallies began in the XAU. A bullish signal for the XAU will be triggered when the 5 period moving average of the XAU/WTIC ratio turns up.
Tim Ord, Editor
16928 Van Dorn Street
Walton, Nebraska 68461
www.ord-oracle.com
(402) 486-0362.
tim@ord-oracle.com