
American Express Co. (NYSE: AXP) was the topic stock for last week’s stock review. This week, we’ll review how to exit the swing trade profitably.
There are two critical junctures in stock trading that are often problematic for traders: when and how to enter a stock and when and how to exit a stock.
The Market Conditions at the time the stock was studied were speculative with High Frequency Trading (HFT) followed by smaller funds chasing, which drove price upward after Dark Pool accumulation in the bottom.
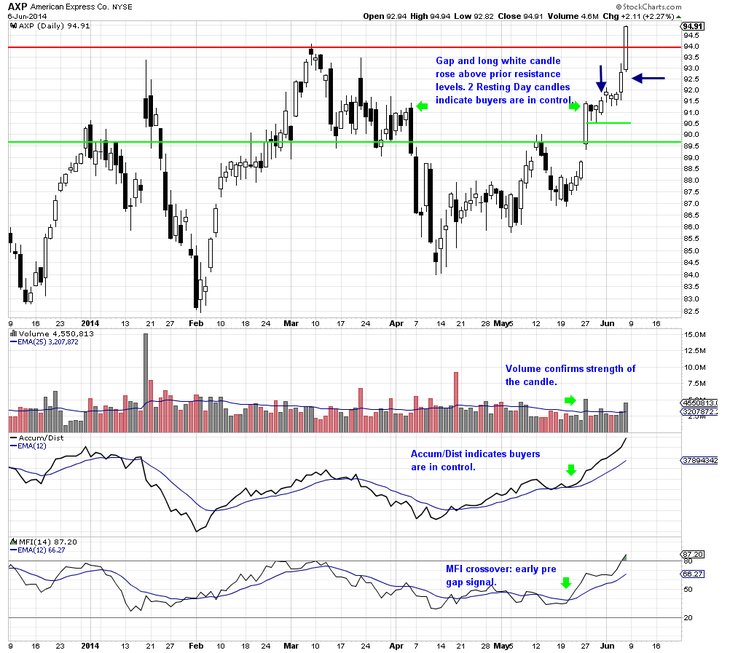
AXP was selected based on buyers taking control during a short-term bottom. AXP was determined to be a swing style trade. The pattern was 2 resting day candles as of 5/29/14 after volume indicators confirmed that larger lots had taken control of the trading activity, accumulating to form a short-term bottom.
AXP formed an engulfing white on 5/30, then a small springboard with two additional resting days before the momentum run. Entry was on the small springboard or second longer springboard, either of the 2 black arrows in the chart below, depending on the trader’s entry rules and order choices.
Determining Your Exit Strategy
The stock has since formed a long white candle and has moved beyond the resistance level of the March high. The candle is an extraordinarily long candle for the chart, so an appropriate exit strategy needs to be determined on the day that such a candle forms.
The energy behind the price action is strong and indicators are just nearing exhaustion levels. There are 2 choices a swing trader can make at this point:
1. Exit the next day and take the profits earned thus far.
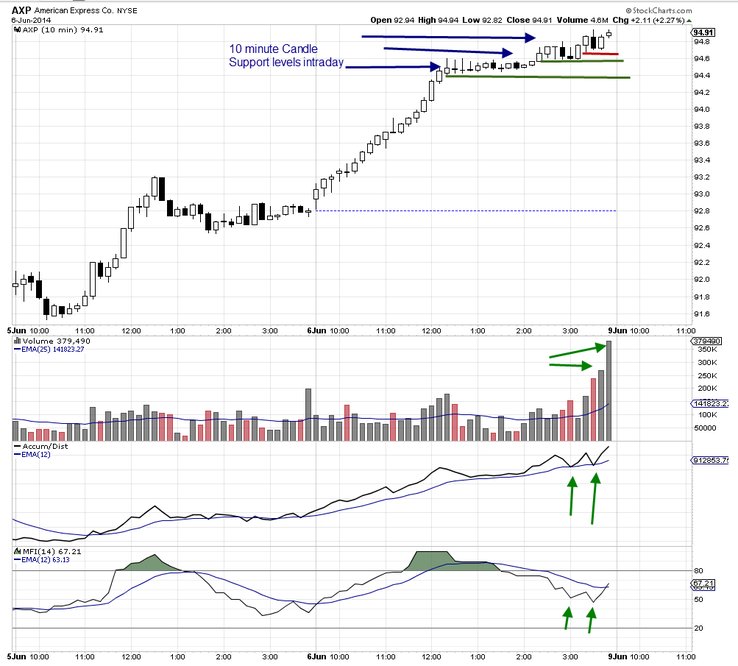
2. Study intraday charts to determine if a sufficiently strong support level formed to continue to hold the stock with an intraday stop loss. This also requires evaluation of the
trading conditions for the next few days. Confirmation that speculative action is continuing is important to this second choice of exit strategies.
Below is a 10-minute intraday chart on the day of the extraordinarily long white candle, 6/6/14. The 10-minute candles show a stronger intraday support level around 94.4, moderate support around 94.6 and weak support at 94.8. Viable support is required for an intraday stop loss, which is placed within the long white candle rather than at normal swing style support levels. Indicators confirm strength and, in addition, an end-of-day (EOD) surge of volume tends to be professional traders and/or retail traders entering as DAY traders holding from EOD to Market Open the next day.
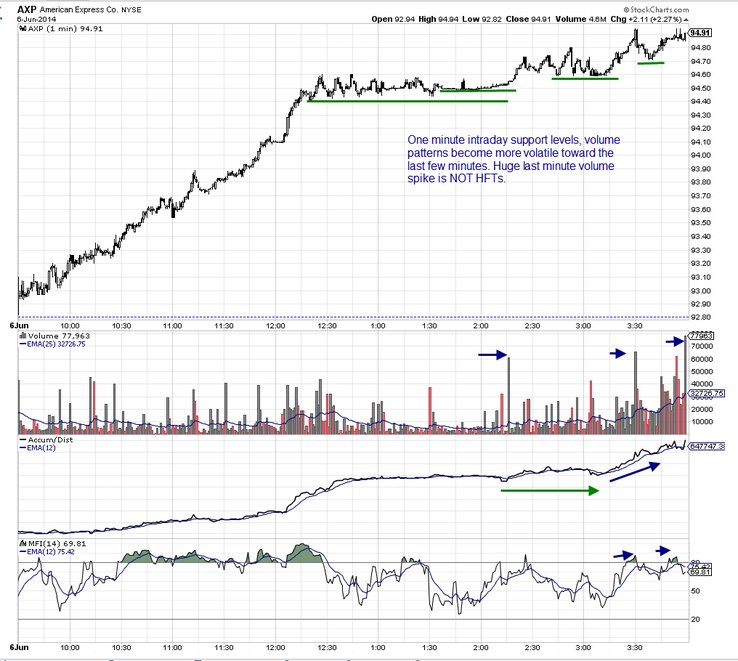
Analysis of the 1-minute candle is also wise, as this can reveal hidden patterns that are not as easily identifiable on the 10-minute candle. Here again, confirmation that the slightly lower support level is indeed the stronger support level with consistency of price action at that level and less intraday millisecond trading or tick trading going on.
Summary:
Swing trading requires reviewing the stop losses for the trade daily, moving up the trailing profit stop to the proper support levels, based on not only analysis of the daily but also intraday charts when a strong, extraordinarily long white candle forms on rising volume. Exhaustion patterns are not present at this time in the chart, but there is the risk of profit-taking after a solid few-point gain for this stock.
All of these factors must weigh into the decision of whether to continue to hold with a tighter intraday swing style stop loss or whether to sell and take profits the next day. These are decisions each trader must decide for themselves based on experience, expertise in swing trading, risk tolerance and current market conditions.
Trade Wisely,
Martha Stokes CMT
www.TechniTrader.com
info@technitrader.com