
Monitoring purposes SPX: Neutral
Monitoring purposes GOLD: Gold ETF GLD long at 173.59 on 9/21/11
Long Term Trend monitor purposes: Flat
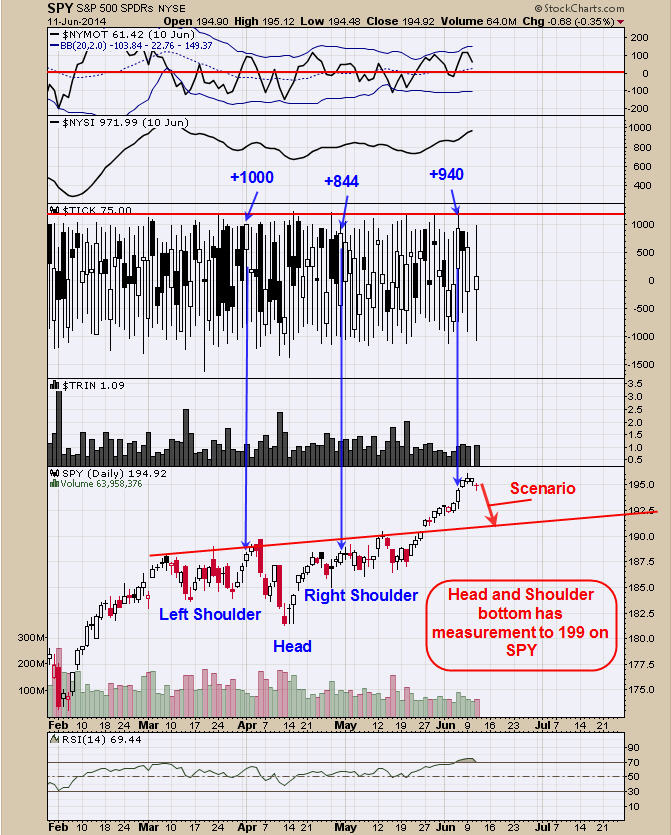
Last Thursday a +940 up ticks close was registered which implies short term exhaustion on the SPY. The previous two times over the last couple of month when tick close where near this level where on April 1 and April 30 (blue arrows on chart) and both times the market stalled and we are expecting something similar to happen here. Support comes in near 191 range on the SPY which is where the May 27 gap formed and is also near where the Neckline of a Head and Shoulders bottom lies. Ideally we would like to see the TRIN close above 1.50 and Ticks close below -300 near 191 to show that area has support. Still looking for a pull back here.
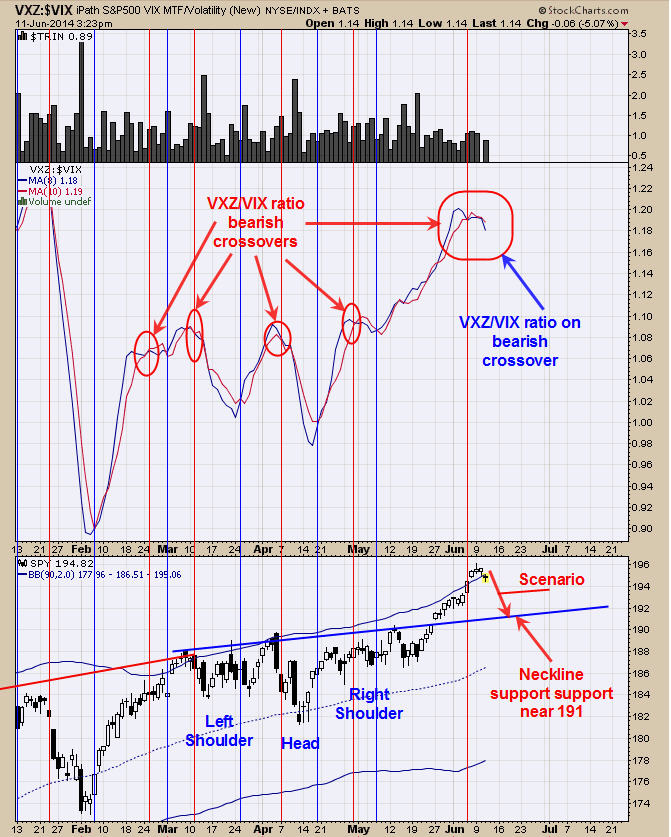
This chart is updated to today’s trading. The VXZ is the SPX mid term VIX and the VIX is the new Volatility index. The VXZ/VIX ratio helps to define the trend of the SPY. We have circled in red where bearish crossover has occurred and the signals have been timely. Over the last couple of days the VXZ/VIX ratio has had a bearish crossover and the uptrend in the SPY may be taking a break. Notice that the VXZ/VIX ratio made lower highs as the SPY made higher highs and a negative divergence. This chart is suggests the uptrend has stalled in the SPY. The VXZ/VIX ratio also helps to find lows in the SPY and we will be looking for bullish signs by this indicator near the next low. Staying neutral for now.
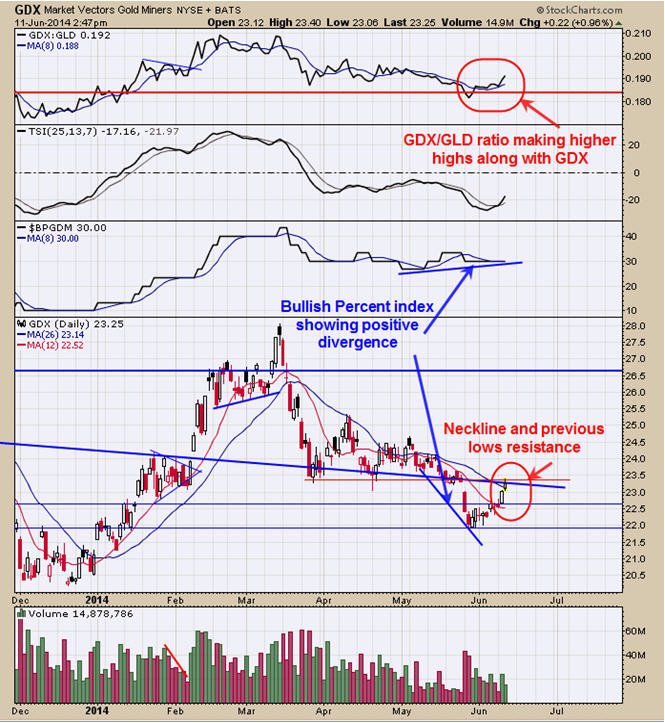
Above is a short term view for GDX. GDX is running into the previous lows of April and May and running into the Neckline from below as well as the gap that formed on 5/27 near the 23 level, all of which are resistance areas. As we said before, if GDX could push to the 24 range or higher would be a bullish sign on the bigger timeframe. There are short term bullish signs here. The GDX/GLD ratio is making higher highs as along with GDX which is a positive sign. The Bullish percent index for the Gold miners is showing a positive divergence over the last month and another positive sign. Either GDX pushes higher to 24 to surpass the current resistance levels or it fails near current levels and need of more base building. The next several trading days should help clear the picture. There are cycles that suggest a low may form in July but it could be a higher low than the December 2013 low which was near 20.
Tim Ord,
Editor
www.ord-oracle.com