Top Advisors Corner July 31, 2014 at 12:49 PM
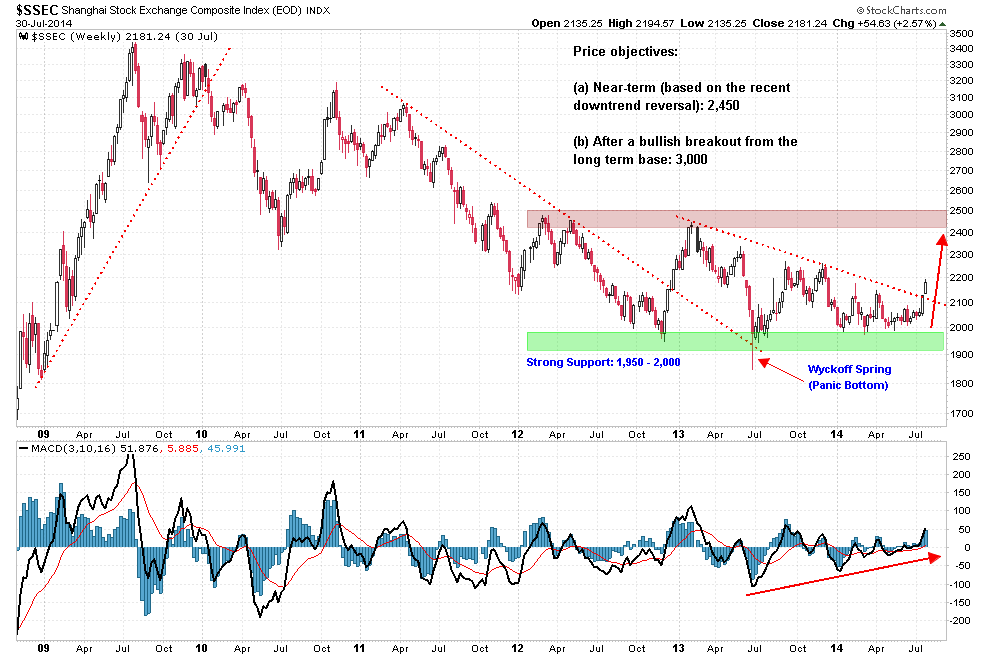
A Wyckoff Spring occurs when an instrument falls below a clearly defined trading range (particularly a closely monitored support shelf), makes a new “panic bottom” (maybe indicated by a huge lower shadow in a candle chart) — and then “springs” back or recaptures the violated supp... Read More
Top Advisors Corner July 30, 2014 at 04:30 PM
Rationales & Targets Despite GDP numbers coming in higher than expected, apparently no one believes it. We certainly do not. Here in NY’s wealthy Nassau County, sales tax revenues are much lower than anticipated and we have seen the identical news elsewhere... Read More
Top Advisors Corner July 30, 2014 at 03:50 PM
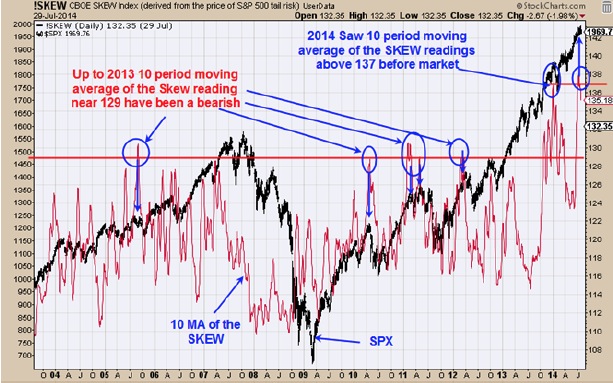
Monitoring purposes SPX: Neutral Monitoring purposes GOLD: Gold ETF GLD long at 173.59 on 9/21/11 Long Term Trend monitor purposes: Flat Above is the 10 period moving averge of the SKEW overlade on the SPX... Read More
Top Advisors Corner July 28, 2014 at 01:15 PM
The Relative Strength Index indicator is unique in that it not only oscillates, but it also is a comparative price analysis indicator... Read More
Top Advisors Corner July 28, 2014 at 11:58 AM
Is China's economy, the second largest in the world, a disaster coming down to a hard landing, which has been the popular forecast for four or five years now? Or is it merely slowing from unsustainable double-digit growth of more than 12% a few years ago, to a more reasonable and... Read More
Top Advisors Corner July 28, 2014 at 10:46 AM
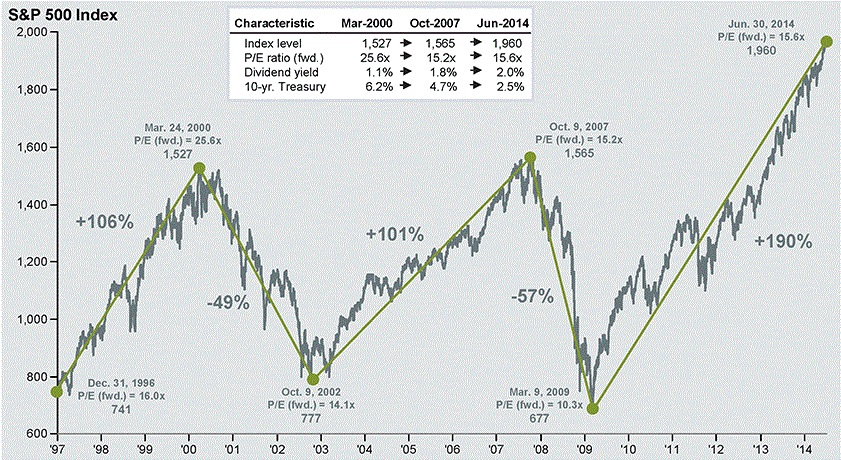
Today, I wrap up my report card series and compare the current market action with the previous market tops in 2000 and 2007, in relation to index levels, P/E ratios, dividend yields and finally the 10-year Treasury yield. This chart was designed by J. P. Morgan Asset Management... Read More
Top Advisors Corner July 25, 2014 at 11:42 AM
Top chatter continues apace and some talking heads are worried about the fact that there has been no correction for 70 odd days. In line with that the Tell on Marketwatch published an interesting chart showing up and down waves. Worth looking at: http://blogs.marketwatch... Read More
Top Advisors Corner July 25, 2014 at 11:35 AM
The Fed is still pumping liquidity into the banking system, albeit at diminished rates, and the large cap indices are still showing no signs of trouble, with the DJIA making higher highs and higher lows... Read More
Top Advisors Corner July 24, 2014 at 11:10 AM
Today, I will answer your questions on if the market is getting close to a sell signal, using my long-term Rip Van Winkle trading system. This system is highly effective at giving profitable trading (buy and sell) signals. Again, nothing is 100 percent accurate... Read More
Top Advisors Corner July 23, 2014 at 03:19 PM
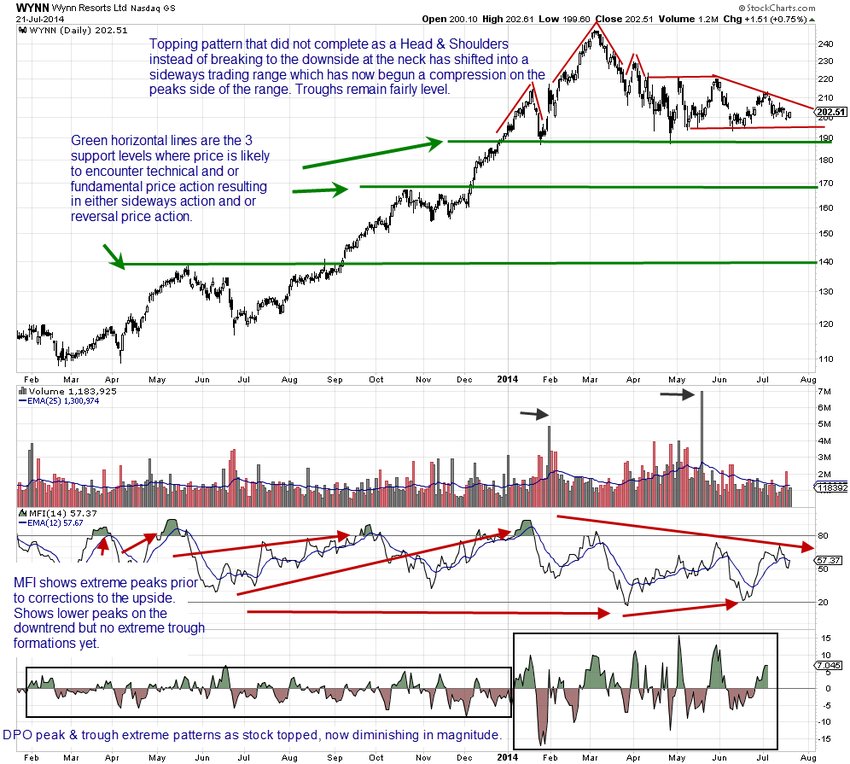
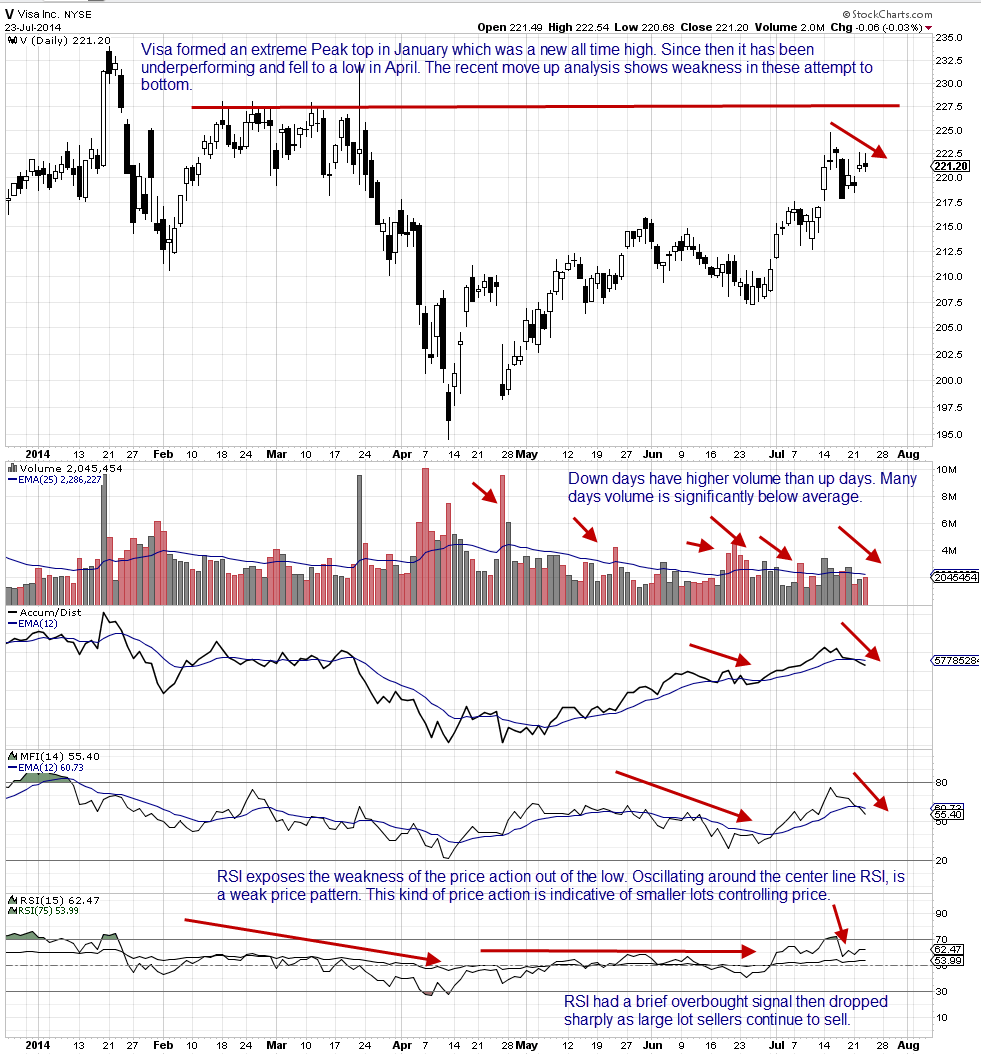
Downside Price Action Is Distinctly Different From Upside Price Action Most technical traders do not spend adequate time learning how to read the downside price action of stocks. Many assume it is the same as the upside, only going down... Read More
Top Advisors Corner July 23, 2014 at 03:13 PM
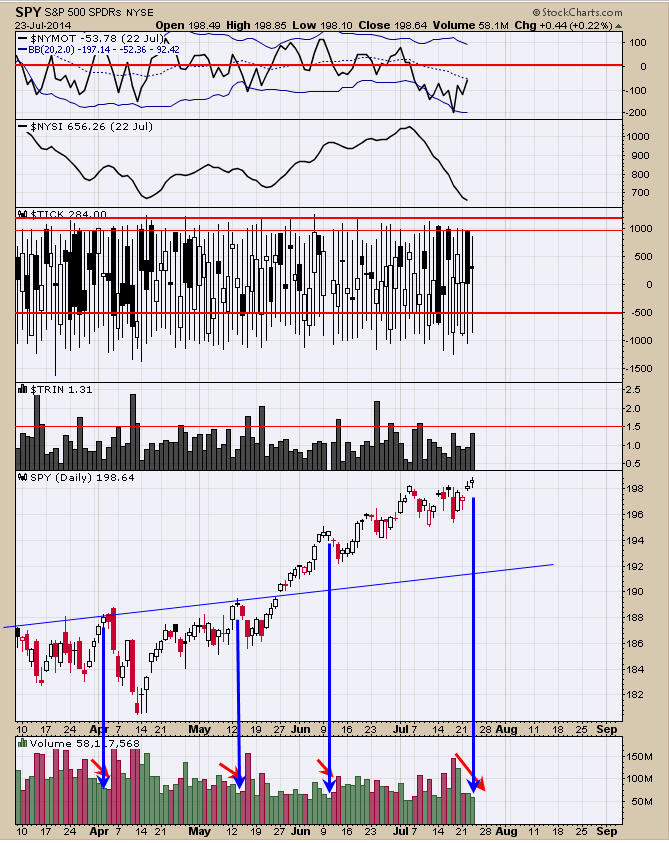
Monitoring purposes SPX: Neutral Monitoring purposes GOLD: Gold ETF GLD long at 173.59 on 9/21/11 Long Term Trend monitor purposes: Flat The TRIN nor the TICK readings are giving much of information right now so we have to look at other indicators... Read More
Top Advisors Corner July 23, 2014 at 11:40 AM
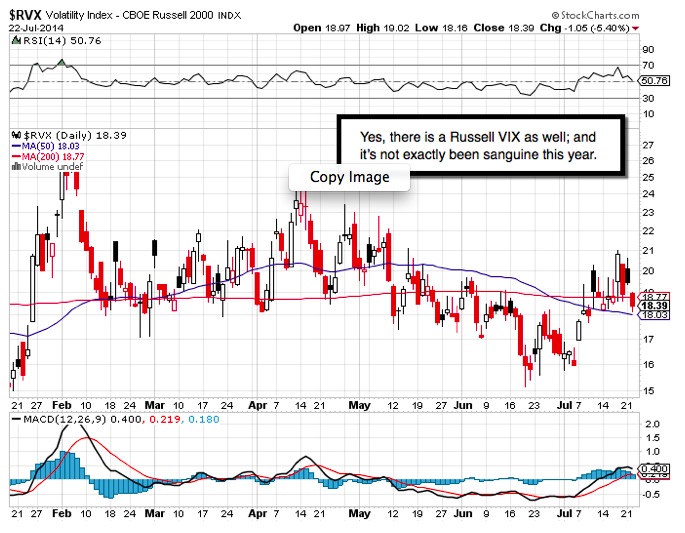
Technical factors based upon on-going 2014 'financial engineering, characterized the first half of the year, in a 'perceived' continuation pattern that was obscured by numerous factors, which suppressed VIX for so long that many technicians have resorted to suggesting it was some... Read More
Top Advisors Corner July 18, 2014 at 01:19 PM
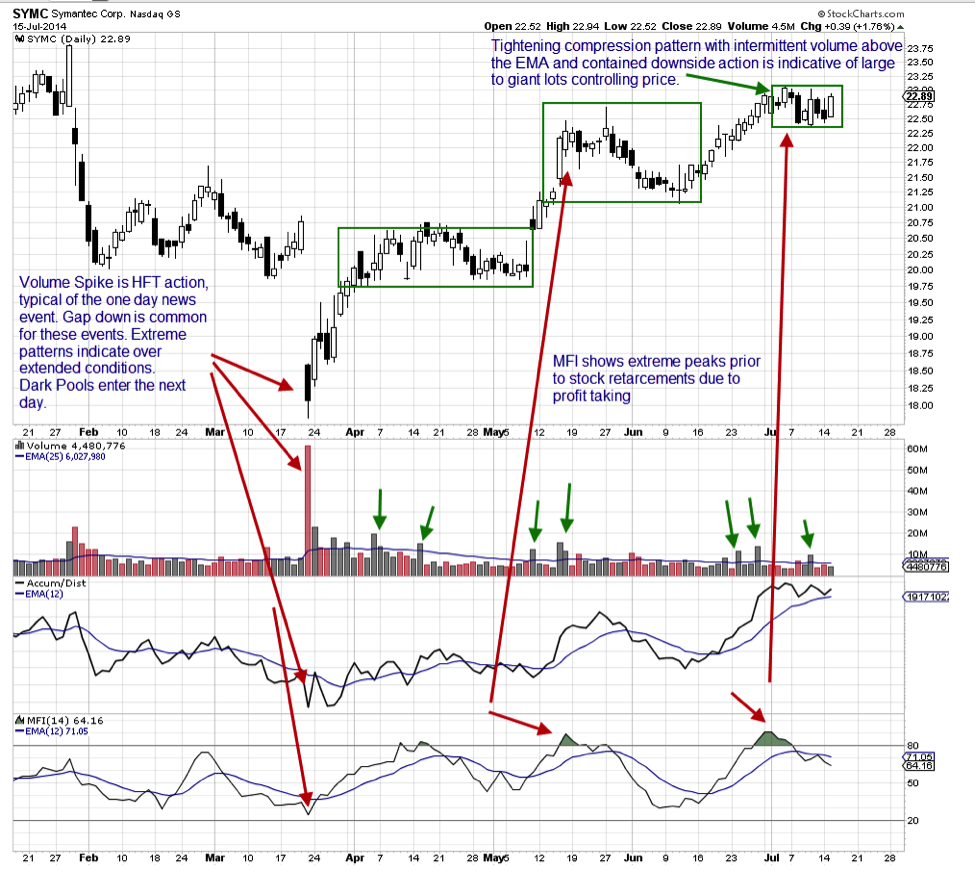
How to Identify High Frequency Trading Action for Reversal Patterns There has been a deluge of articles, commentaries, and debates about High Frequency Trading action. Technical Traders can learn to use HFT action to their advantage... Read More
Top Advisors Corner July 17, 2014 at 01:28 PM
The price bottom associated with gold's 13-1/2 month cycle is ideally due right now. The problem is that gold does not always bottom exactly when it is supposed to, and there is still work yet to do... Read More
Top Advisors Corner July 16, 2014 at 02:43 PM
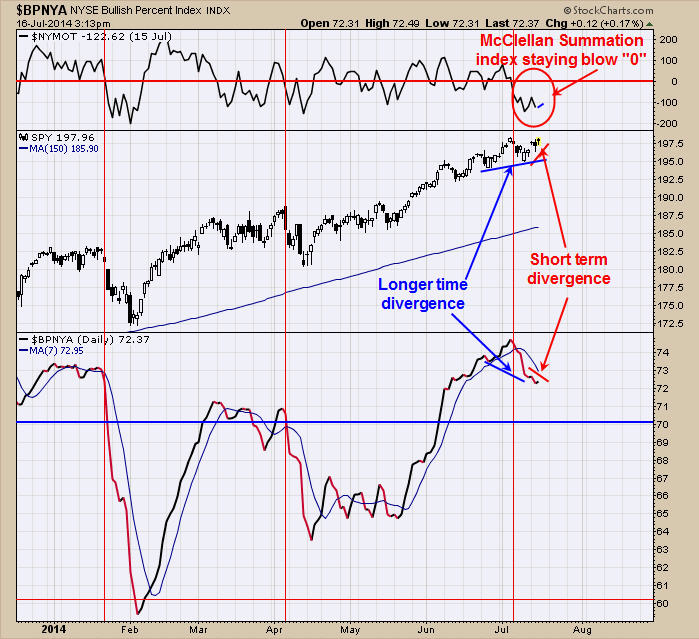
Monitoring purposes SPX: Neutral Monitoring purposes GOLD: Gold ETF GLD long at 173.59 on 9/21/11 Long Term Trend monitor purposes: Flat Timers Digest recorded the Ord Oracle report number 10 in performance for one year time frame dated July 12... Read More
Top Advisors Corner July 14, 2014 at 02:26 PM
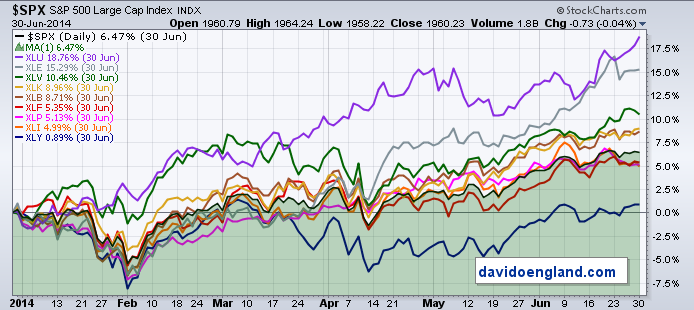
Today, I will prove the truth of one of my favorite sayings, “It is not being in the market that is important, but what we are in that is.” Last week, I audited the first half of 2014 market performance... Read More
Top Advisors Corner July 10, 2014 at 01:45 PM
July 10, 2014 Back in September 2013, I wrote about a unique new way to forecast inflation. That piece called for a pickup in inflation, which has materialized, and so it is worth taking another look to see what more is ahead... Read More
Top Advisors Corner July 09, 2014 at 12:54 PM
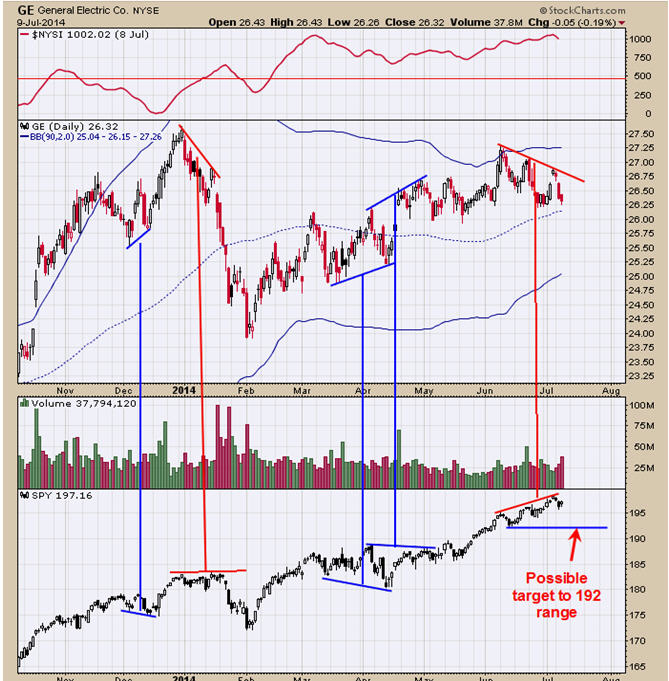
Monitoring purposes SPX: Neutral Monitoring purposes GOLD: Gold ETF GLD long at 173.59 on 9/21/11 Long Term Trend monitor purposes: Flat It is said “where ever General Electric (GE) goes so does the S&P”. The second window down from the top is GE and the bottom window is the SPY... Read More
Top Advisors Corner July 08, 2014 at 01:10 PM
On Monday evening, I wrote to subscribers that despite Monday's weakness, our "Best Trend" indicator was not budging. I said that it was going to be hard to get anything worthwhile going on the down side until this positive indicator changes and that is still my position... Read More
Top Advisors Corner July 08, 2014 at 01:00 PM
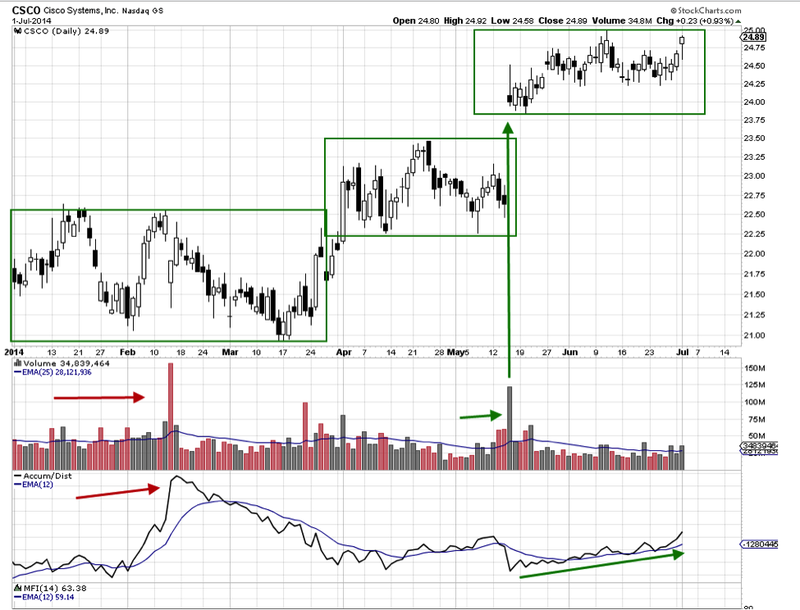
Weekly Stock Discussion: Cisco Systems Inc... Read More
Top Advisors Corner July 06, 2014 at 12:43 PM
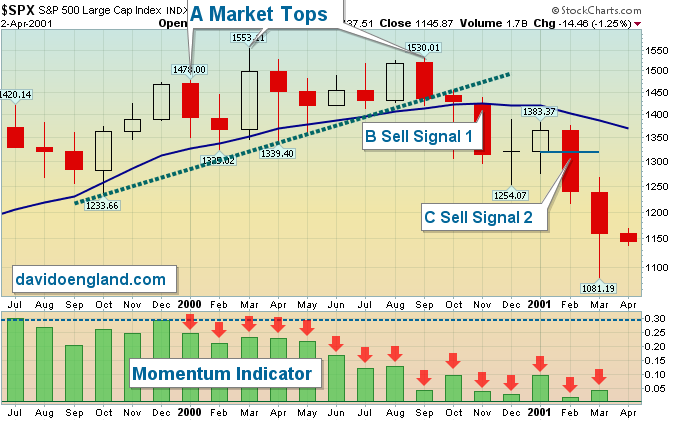
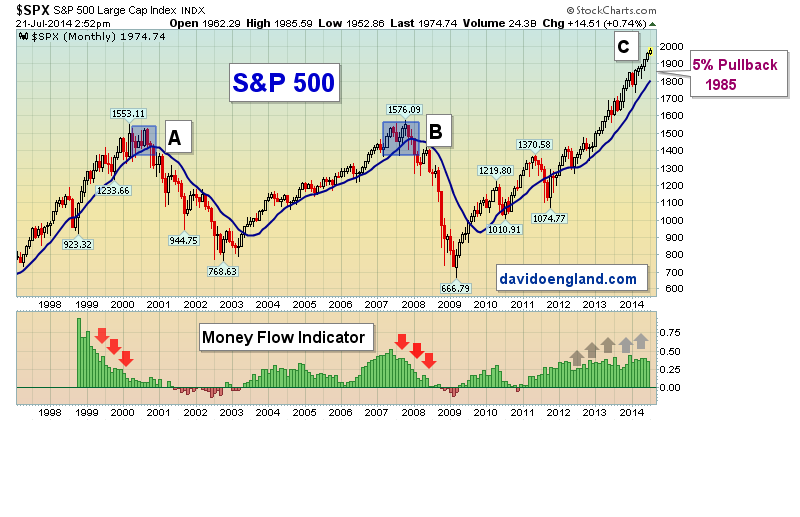
Today, I answer many of your questions concerning market tops. For a better understanding on how market tops form, I will dissect the 2000 market action using technical analysis (charting). It is not called “technical” for nothing... Read More
Top Advisors Corner July 06, 2014 at 12:00 PM
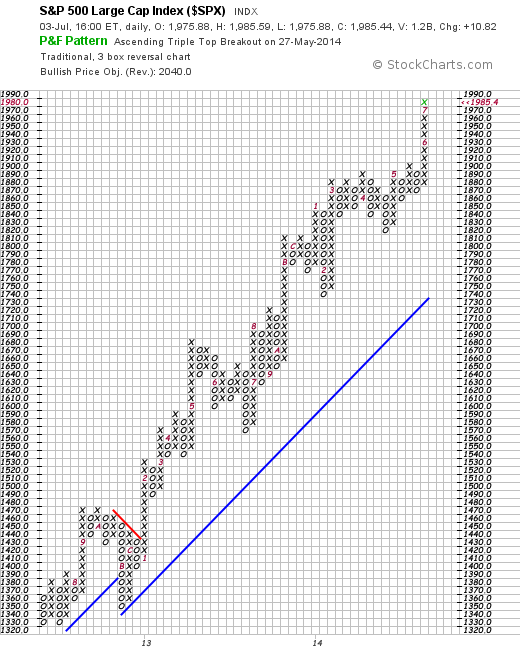
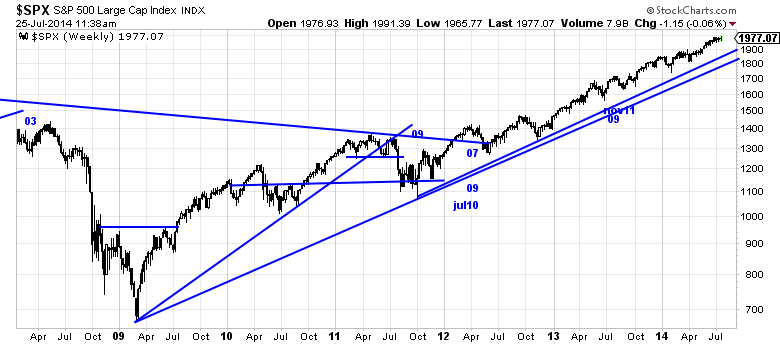
As the PnF chart thinks we are still in the bull market with a target of 2040. Do we believe it? Come now. How many times have you heard us say that we are total agnostics? It is true that we have constantly used the PnF chart to update targets going back hundreds of points... Read More
Top Advisors Corner July 02, 2014 at 02:22 PM
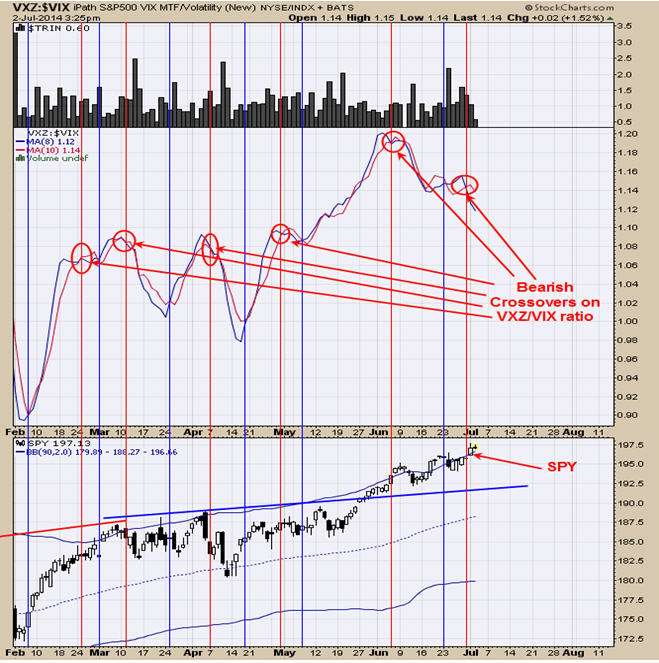
Monitoring purposes SPX: Neutral Monitoring purposes GOLD: Gold ETF GLD long at 173.59 on 9/21/11 Long Term Trend monitor purposes: Flat We have shown this chart in the past which is the VXZ/VIX ratio... Read More
Top Advisors Corner July 02, 2014 at 01:20 PM
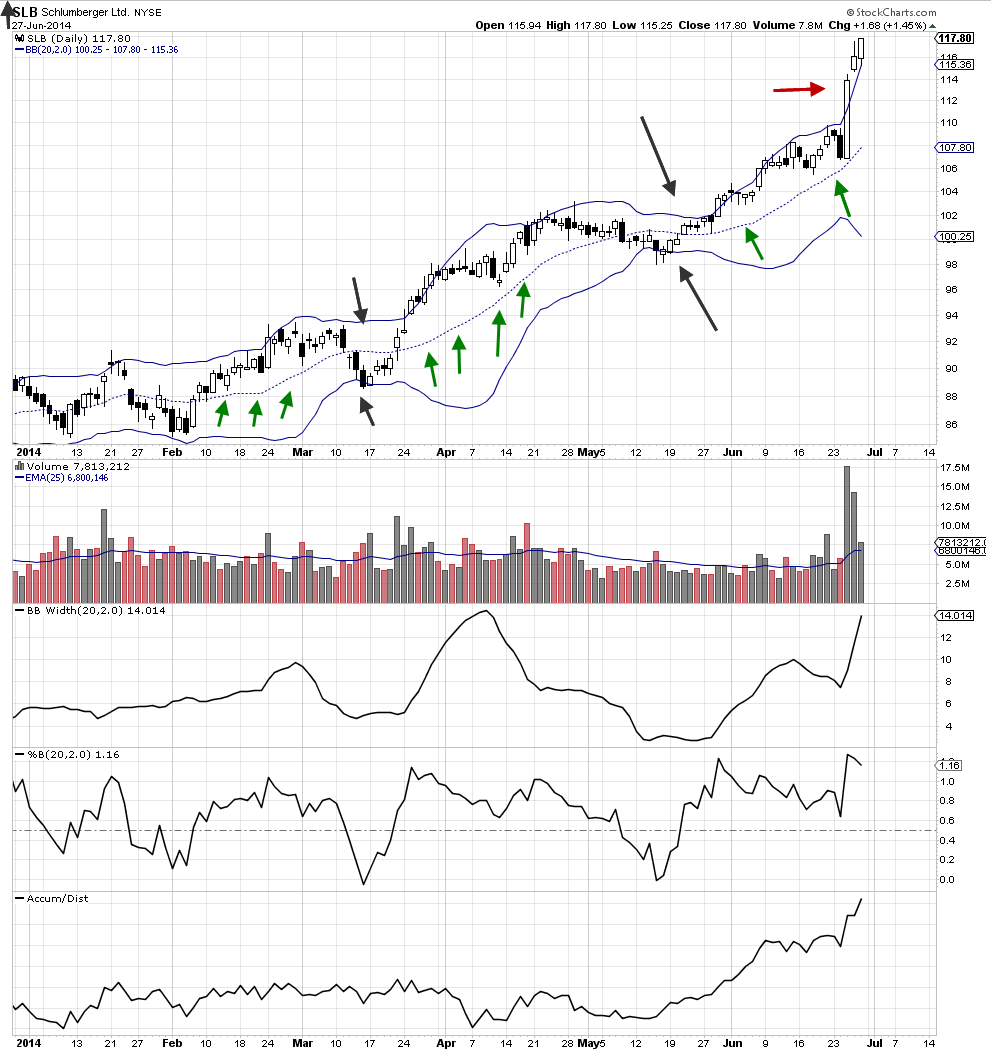
How to Use Bollinger Bands for Better Stock Picks Bollinger Bands are an excellent tool for helping develop Spatial Pattern Recognition Skills, those visual skills which all expert technical analysts have... Read More
Top Advisors Corner July 02, 2014 at 11:30 AM
Rationales and Targets The NASD released margin debt stats for the month of May on Friday and we expect to cover our views on leverage again in the July issue. Total margin debt (NASD + NYSE) remained steady at $475 billion, 2.8% of GDP... Read More