Rationales & Targets
Despite GDP numbers coming in higher than expected, apparently no one believes it. We certainly do not. Here in NY’s wealthy Nassau County, sales tax revenues are much lower than anticipated and we have seen the identical news elsewhere. Consumers are not spending and the country’s economy is clearly not growing. We expect revisions to disappoint. Margin debt is once again at an all time high, over a half trillion dollars. Stocks are the most leverages they have ever been and the market is an accident just waiting to happen. Despite valuation measures at historic extremes, the temerity of bulls forecasting a continuation of the bull to levels 15% higher is shocking. Has the memory of the two prior manias faded to zero? We believe the Federal Reserve will do whatever they can to prevent a full scale meltdown if things begin to fall apart, but we are not confident that they will be able to halt a cascade of lower prices. Simply put, there is way too much leverage for participants to handle. We expect interest rate policy to remain favorable. Today’s action in the face of the supposedly strong GDP numbers is very telling. When stocks begin acting badly when good news arrives, it is the perfect environment for a correction to begin, let alone a bear market. We remain bearish and believe a new bear market is underway.
Something Is Amiss
-THE FOLLOWING IS EXCERPTED FROM OUR CURRENT ISSUE -
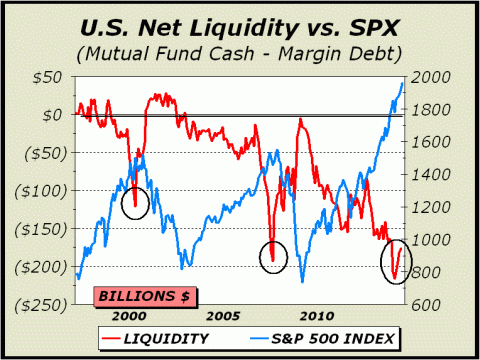
Through June, net liquidity improved modestly from the February low, as total margin debt hit a new record high and mutual fund cash reserves modestly improved. However, “improvement” is a relative term and in this case, only means the indicator has previously been worse. Since 1929, we have seen more negative readings only in the five months before June and in July 2007, three months before one of the most historic peaks in stock market history. While the major averages have not yet turned down as they have before with net liquidity bottoms in 2000 and 2007, we do not see present action as a positive divergence. The key to persistent price gains has been the Federal Reserve’s policy to keep the printing press rolling 24/7. This was not a factor at the previous market peaks, so we believe the top has only been delayed, rather than forfeit to continued accommodation. Clearly, the peak in the mania that concluded in 2000 proved the concept that no price is too high cannot possibly work. Eventually, there must be a reaction and the impulse to sell dominates completely. We identified that trigger in late 1999 and early 2000, and correctly predicted that Nasdaq would crash by one-third in only six weeks. As well, the peak in 2007 offered proof that an over leveraged market entertains so much systemic risk that a correction is inevitable, simply to bring risk exposures back to a more sustainable point. We correctly identified that trigger as well, and were only a few points off on our forecasted bear market bottom. We have focused on the problem of derivative exposures for major U.S. banks for years. The trigger for the present phase will likely be a combination of circumstances, including massive overvaluation and risk exposures. In recent issues, we have cited the charts of several major U.S. banks, noting indications of stress that imply the potential for trouble immediately ahead (see page three, “Something Is Amiss”, June 29th issue of Crosscurrents). Current circumstances are so bizarre that we are convinced a major stock market peak is unfolding, one that will require yet another horrible bear market to correct the excesses that have built during this five and one-third year run. Our featured chart is only one perspective of many. At bottom left page two, is a chart every bit as startling and informative. It deserves to be on the front page of every newspaper as an alert to investors that risks have never been higher in their lifetimes. Why this information should be treated as so esoteric that it is undeserving of exposure is puzzling. We have even yet to see this perspective anywhere in the financial press, despite the extent of this extraordinary situation. Margin debt versus GDP has been higher only once, in 1929, when stocks could be purchased for as little as 10%, with 90% borrowed money. The Federal Reserve Board’s Regulation “T” has limited leverage to 50%, meaning an equal amount of borrowed money since 1974. In 1929, even an ordinary stock market correction of 10%, a circumstance that occurs every 1.44 years on average, would wipe out margin players. The 1929 Crash was inevitable. A simple correction was the catalyst for the cascade of losses that occurred. Excess leverage in 2000 and 2007 had a lesser but similar effect. An ordinary 10% correction would mean a 20% erasure of wealth. A 25% bear market, the kind of circumstance that historically takes place every 5.8 years on average, would erase half of one’s wealth. Thus, the impetus for collapses as we suffered from 200-2002 and from 2007-2009 were also inevitable. The Federal Reserve was responsible for both the previous manias and their collapse by continuing margin requirements at 50%. It is no wonder we see the possibility of an identical resolution. At the very least, a correction of 25% is inevitable.

Alan M. Newman
Editor, Crosscurrents
www.cross-currents.net
