
Today, I answer many of your questions concerning market tops. For a better understanding on how market tops form, I will dissect the 2000 market action using technical analysis (charting). It is not called “technical” for nothing. Please read through the explanation to the end to get the full flavor of my explanation.
One of the first things I learned when starting my journey in the stock market is that many times market tops take a lot longer to form and can make three to four tops before the market corrects. In turn, market bottoms are usually V shaped and act just the opposite.
I designed today’s chart using the $SPX (S&P 500) during the described 2000-2001 (monthly) time frame, with the SPX value in the top box and important momentum indicator in the lower box. I also have my blue signal line front and center.
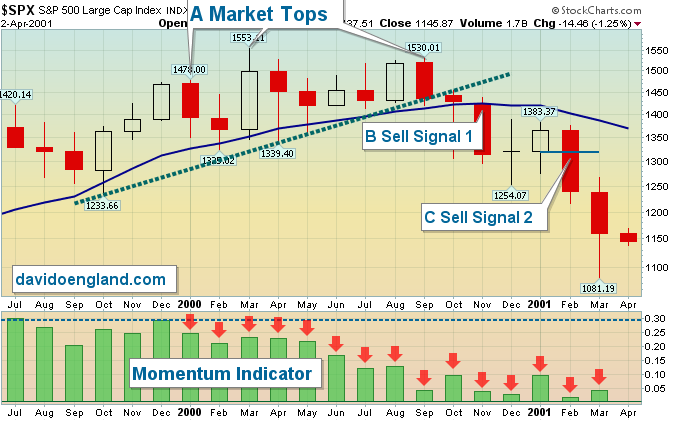
First, let’s review. When the SPX value crossed down and closed through the blue signal line and traded under that value the next month that is a sell signal. Let’s see if my system has merit in this scenario.
Start with point A-showing the three market tops in January, March and September 2000. In October 2000, the SPX traded under the multi-month (Green dash) trend line, but closed above the blue signal line.
Point B. In November 2000, as soon as the SPX failed to rally above the previous month and traded under the blue line, it signaled the first system sell signal. In the lower momentum box, you can see how the green momentum bars get smaller, signaling less involvement by the institutions-confirming the first sell signal. If the bars were getting taller, this would negate any sell signal.
Point C. Sell signal two hit during February 2001 when: 1. The SPX did not rally and close above the previous month high or blue signal line. 2. The SPX traded lower than the body of the previous month. 3. The momentum indicator confirmed the sell signal with increasingly shorter bars.
Next week, I will use my same trading system to dissect the market action in 2007/2008 to see if there are any similarities. If no similarities exist, my system can go in the trash. If there are similarities during both 2000 & 2007, then consider my system to analyze if we are currently making a market top.
Plan your work, work your plan and learn to share your harvest!
Full Disclosure-I do not hold any of the securities listed in this column.
DAVID O. ENGLAND is the founder of the Eye on the Market Radio Show and Training Academy and retired associate professor of finance at John A. Logan College. This column is presented for educational purposes only and is not intended as financial advice. For questions, contact England at thetraderseye@gmail.com.