
Technical factors based upon on-going 2014 'financial engineering, characterized the first half of the year, in a 'perceived' continuation pattern that was obscured by numerous factors, which suppressed VIX for so long that many technicians have resorted to suggesting it was somehow broken. We contended it was not; merely reflected the engineered rescuing of every dip, which engendered a complacency among a majority of technical traders.
There is actually a Russell volatility index that better reflected 2014's activity and alternating moves. S&P upside price behavior is dominated by periodic recovery rallies among the 'most shorted' stocks (per charts shown in our Daily Briefings). It reflected short-covering squeezes, or influences of buybacks for instance, more so than revealing true internal technical conditions.
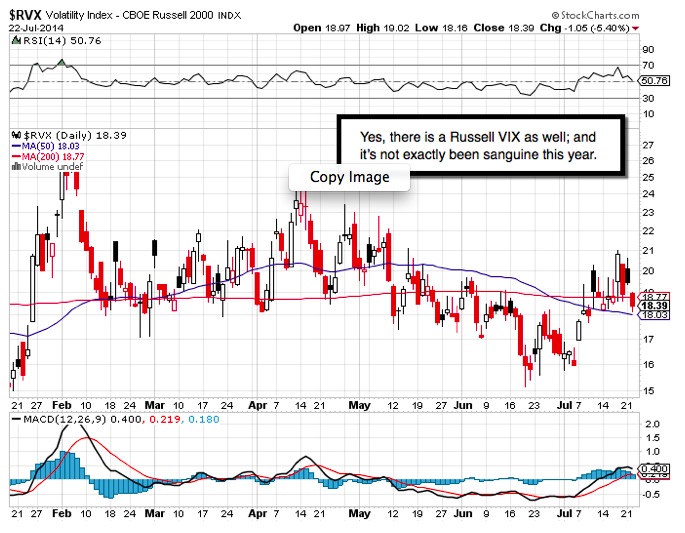
This is just how you could have (say in July, a time when our daily work called for a rocky period to commence preceding more dangerous times) while the S&P VIX remain suppressed (inverse readings to the S&P of course) the Russell VIX (RVX) oscillated more realistically. Why would that be? The Russell 2000 better reflects the broad market; and domestic centricity. It is not so-dominated by a handful of big-caps that give illusions of strength not broadly existing.
Many financial outlets and technical services have tried to mask the 'real' behavior of 2014, by persistently bombarding investors with nonsense about substantive global recoveries (reality has shown suppression of organic growth by virtue of extending expansionary monetary policies applied too long, resulting in enhancing asset prices while denying needed capital to the private sector, as in 'for instance' infrastructure rebuilding on a massive scale). This could be gleaned 'technically', by realizing Federal 'Debt Service' is impossible if they 'allow' higher rates.
Part of this 'mask' has contributed to technicians either ignoring or repressingany analysis that truly sought to 'link' the market's internal distribution to the changes unfolding in both monetary policy and economic realities, or the impact of global economic and geopolitical factors this year. This obfuscation generally continues.
Because 2014 hinged more-than-usual on the disconnect between market levels and economic realities, we repeatedly have 'charted' this disparity; making a point that to attempt using only 'technicals' to assess stock markets, without integrating fundamental and monetary underpinnings, was not only a disservice to investors and traders, but disingenuous as serious market analysis.
To wit: this year more so than since calling for an 'Epic Debacle' in 2007-'08 or a 'Crash in 2000', or 'Bull Market' from 2002 forward, all preceded by discernible events beyond merely 'pure' technicals; we integrated the various influences in a potpourri of factors able to shake-up 'conventional' wisdom of the Fed 'threading the needle', and backing-off as recovery arrives.
It is not so simple going forward; and continues to suggest integrating various factors to arrive at the 'psychology' of current market behavior. To this analyst, doing so may not be expedient, or an easy non-burdensome way to simplify efforts necessary to understand this market, but IS proper 'technical analysis'.
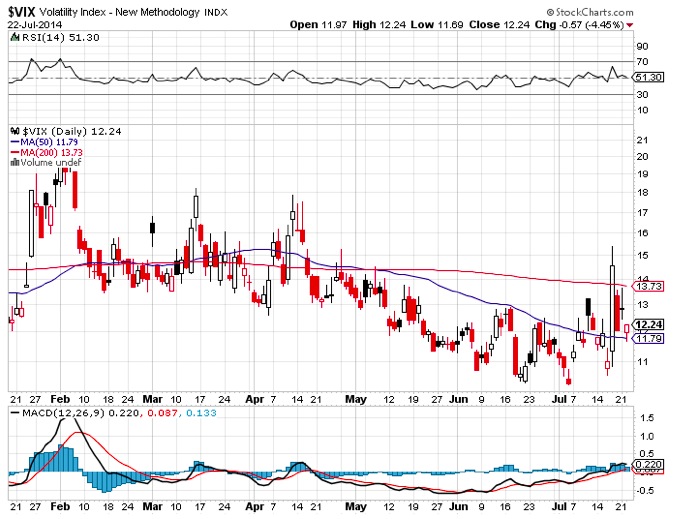
Simply put: VIX, while obviously degraded by 'time', is not broken. The structure of variants like VXX are such that they are not viewed as optimal for anyone using them for hedging (and some don't even reflect short-term moves properly). VIX works for sharp traders who are hit-and-run; or at times desire insurance to protect against portfolio erosion -or rallies- believed pending.
In the Spring decline of about 60 handles in the S&P; VIX soared; then markets lulled way-back into complacency, as every comeback was successful. On the surface. That's due to a mix of 'technicals'; such as 'tapering' by the Fed; buybacks that reduced a quite-bloated number of available shares; low yield available to risk-averse investors compelling equity chasing of course; and Oscillator deterioration through Spring and early Summer at the high.
GDP realities widened the noted disparity, and when the market of course was 'shocked' by the horrific shoot-down of a Malaysian Airlines 777; the VIX jumped a phenomenal 30% or so within two hours. Though of course reversed as markets recovered, clearly proving my point that it's not broken as a technical reflection of underlying S&P behavior, plus premium nuances too (investor apprehension).
This has been a market of too much money chasing too few shares, with unimpressive facts to underpin the market, which should be at lower levels for this pace of growth if not for lack of any other place for money to run. A market that's levitated solely by money-printing and leverage (a look at the SKEW will show that danger) in the face of numerous officials warning that monetary policy is in the process of change (mostly after the midterm elections we'd presume, but able to anticipate that), is a market that is based on unsustainable 'smoke & mirrors', as now it's Bulls that are 'fighting the Fed'. We present evidence to substantiate that. The behavior of VIX is one part of what we believe is a valid -perhaps essential- form of technical analysis in this era. It's not for most to trade; but to understand.
We know this viewpoint has been suppressed or trivialized by some who try denying investors a grasp of ongoing interrelationships; while traders ground-in-reality know well our perspective. In my view, VIX serves as one reflection of market destabilization for the primary trading vehicle in our daily work, which is moving in-and-out long-or-short, with the E-mini S&P.
Regards,
Gene
Gene Inger
www.ingerletter.com