
How to Use Bollinger Bands for Better Stock Picks
Bollinger Bands are an excellent tool for helping develop Spatial Pattern Recognition Skills, those visual skills which all expert technical analysts have. For many technical traders, trying to recognize sideways price action early on and how price will behave during that sideways pattern is the number-one analysis skill they struggle to learn. By adding Bollinger Bands to your stock charts, you are able to have expanding and contracting channels which reveal far more than any other type of channel.
There is a reason why Bollinger Bands are the most popular of all of the channel indicators. Their creator, John Bollinger, CFA, CMT, designed these unique bands in a way that allows the bands to respond to and move with the candlesticks themselves, as well as moving with the trend.
Although many technical traders apply Bollinger Bands directly to the price chart, they can also be applied to indicators as well, often revealing aspects of the indicator which are not easily seen without the bands.
John Bollinger has also written several variations of the Bollinger Bands, including Bollinger Bandwidth, an excellent version of the bands to be used when the technical trader prefers not to have the bands on the price chart but still needs to see the compression of the bands. Bollinger Bandwidth offers the best of both worlds with expansion and contraction patterns without interfering with the interpretation of the candlestick charts themselves. It can be used in a line graph or histogram, depending on the technical trader’s preferences.
Bollinger Bands %B is also a superb indicator for identifying extreme patterns that signal a significant price shift. This indicator, and how to best use it, will be explained in a later stock chart discussion.
Today’s discussion is Bollinger Bands and Bandwidth combined, so that technical traders can decide which will be most beneficial for their trading style and parameters.
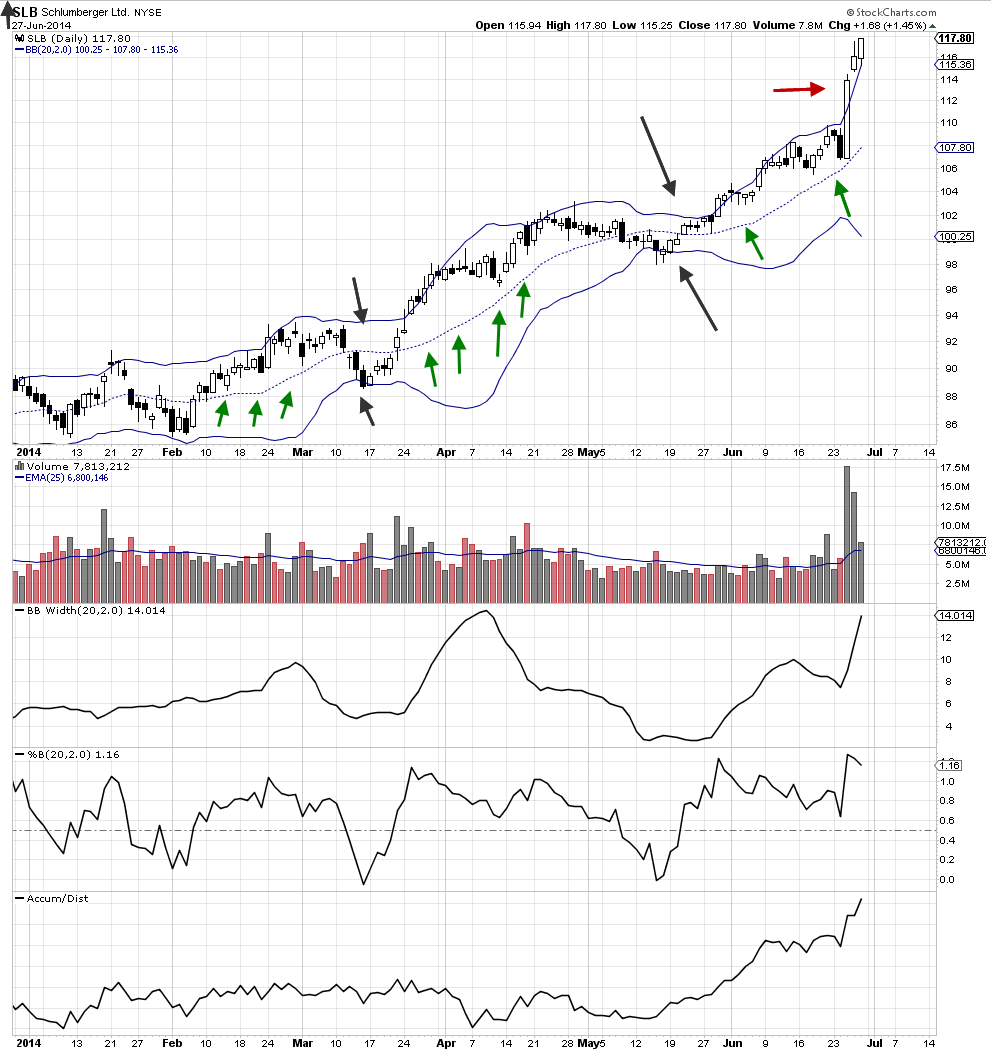
Stock Chart Example: Schlumberger LTD, SLB
SLB has been moving sideways as it slowly, but steadily, moved upward since January. The mild and short-term retracements provided several entry opportunities as the price action compressed and then moved up again.
The black arrows point to the contraction of the Bollinger Bands. However, what is far more important are the green arrows, which point to the price holding well above the middle line on 3 different sideways patterns as the stock moved up. This reveals a strong momentum upside bias despite the lack
of long momentum white candles during that time. The huge white candle caused by High Frequency Trading, HFT, on Wednesday, June 25th was the only strong momentum price gain, and extraordinary in its size.
In January, the Bollinger Bands have a very consistent width, narrower than normal, which maintained more candles above the center line than below, clearly showing the upside bias in this basing bottom formation, which is a new Dark Pool bottoming pattern. The second compression is tighter than the base bottom, and the stock moves up further. The third compression of the Bollinger Bands is significantly narrower, indicating that price has become very tight and compacted, a common pattern prior to an HFT sudden run or gap.
Below is another chart showing just the Bollinger Bandwidth and how this variation of Bollinger Bands allows the technical trader to view not only compression patterns in the Bollinger Bands, but also the individual candlesticks and potential entry signals. The horizontal black arrows show the consistent Bollinger Bandwidth during the basing bottom that is consistent with Dark Pool quiet accumulation. The second set of black arrows show the first compression of the bands. The third compression forms lower on the Bandwidth indicator chart, which shows that this compression is significantly tighter than the previous one. The entry could be made at several levels during that compression, allowing for a hold period before the HFT big one-day run. The slight dip in the Bandwidth at a much higher level indicates the potential for a breakout.
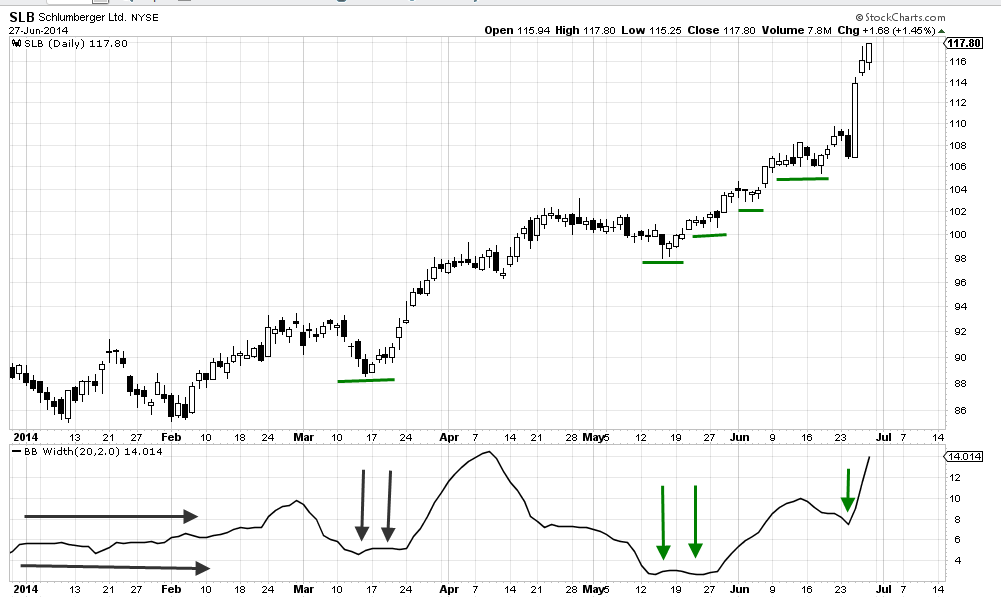
Using the Bandwidth allows technical traders who use candlesticks to see not only the compression of the bands, but also the candlesticks clearly and easily. This is an excellent combination for those who rely on candlesticks for precise, controlled entries.
Summary
Bollinger Bands are an excellent indicator for technical traders. They offer a variety of patterns, signals, and variants, which all allow technical traders the ability to understand price patterns better and to recognize changes in price action preceding big moves and breakouts.
Because Bollinger Bands are a price and time indicator, employing some volume indicators along with it is critical to consistent success when using these indicators. Technical traders must always analyze the complete set of data from the ticker tape. Price, Quantity, and Time must all be evaluated. Volume, expressed through Quantity indicators, will reveal the direction of the breakout and momentum move. Bollinger Bands alone do not show the direction the stock will take, only that a breakout is imminent.
Trade Wisely,
Martha Stokes CMT
www.TechniTrader.com
info@technitrader.com