
The Relative Strength Index indicator is unique in that it not only oscillates, but it also is a comparative price analysis indicator. Instead of simply showing overbought or oversold conditions, RSI has the ability to provide comparison analysis of the current price trend against the price trend X periods. This type of comparative price analysis is uncommon in stock indicators, and it has become far more relevant in recent years, as the growth of Dark Pool venues has grown exponentially. These Alternative Trading Systems, which are both partially-lit and totally-unlit over-the-counter transaction platforms, control anywhere from 9-13% of the total consolidated ticker tape volume each trading day. This is a huge amount of large-lot to giant-lot orders that are not trading on the regular exchanges.
The Dark Pools are such important clients to these ATS venues that many unique types of orders have been developed for their exclusive use. Any change in order processing, order flow, quantity, or venue can alter price and volume patterns on a stock chart.
Choosing the optimal indicators for analysis in the new market structure requires the understanding of how, what, when, where, and why Dark Pools are buying or selling. These orders' intent is to accumulate stock slowly and incrementally over many weeks to months or to rotate out of a stock in the same controlled way, lowering the quantity of shares held without disturbing price.
August is the month when the major funds frequently make significant adjustments to their base portfolios, lowering held shares of some stocks, acquiring more shares of others, and buying into new stocks previously not in the portfolio.
RSI is an excellent indicator for evaluating price overtime in comparison to volume patterns and price patterns. RSI often reveals subtle patterns not easily seen in pure candlesticks. By understanding the nuances of this powerful indicator, technical traders can improve their stock pick selection for both buying long in up-trending market and selling short during down-trending markets. When markets are sideways, which occurs much of the time, RSI also performs better than many other more popular and overused indicators. Since RSI is not an overused or exploited indicator and is not part of the “systems” sold to most retail traders, High-Frequency Trading algorithms are not using RSI for tracking cluster orders. This is also a huge advantage to avoid front-running by HFTs.
Visa Inc. (NYSE:V) is a Dow Component stock, but it has not been doing well so far in 2014. With an extreme vertical Peak Top in mid-January, it slumped and then fell to support in April. It has been slowly moving upward since then. However, when studying RSI, there are many aspects of the recent price action which reveal weaknesses within the current run up from the April low.
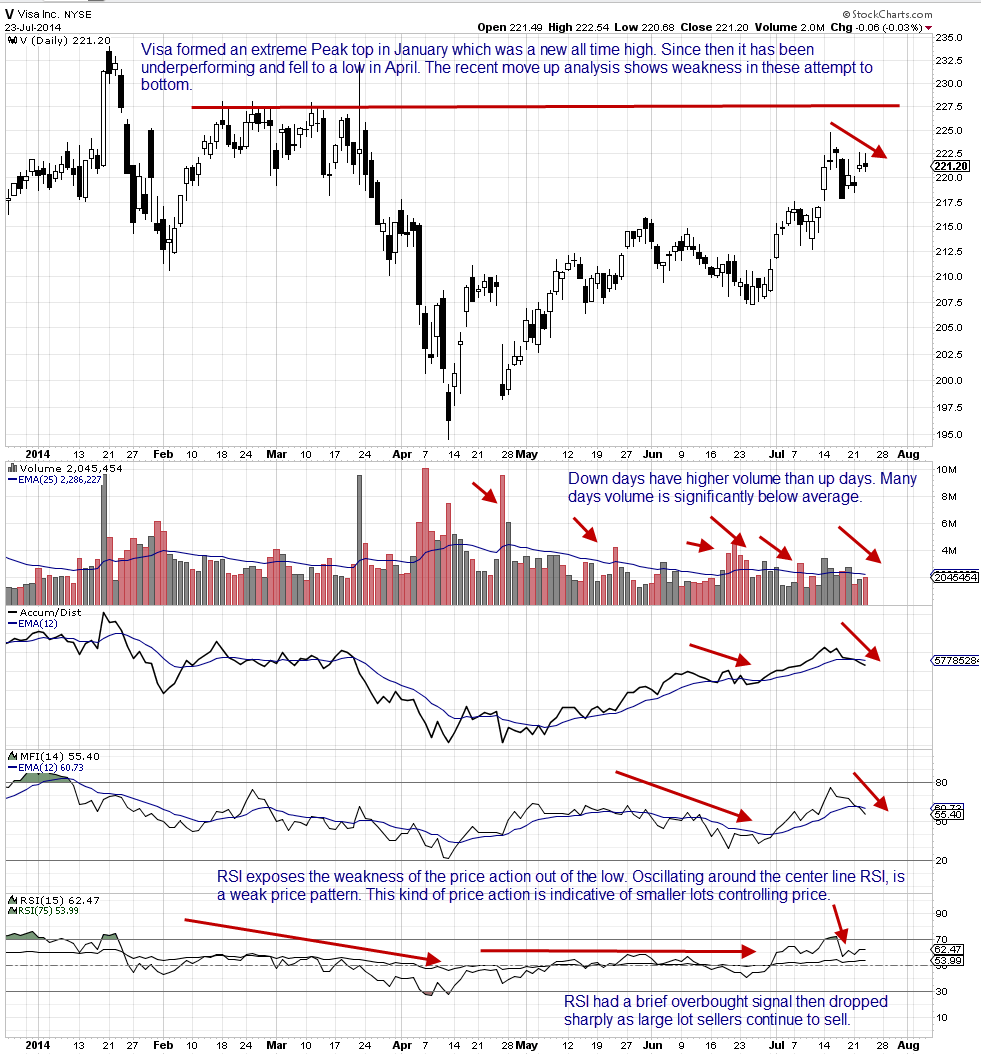
For this analysis, the RSI has an additional longer RSI line in order to provide a center-line oscillation analysis, which is highly useful for comparing volume distribution patterns to price activity over time. This kind of analysis not only considers the current price action, but also prior price action along with volume in order to determine the strength of the current candlesticks, now pausing just below the resistance from December-February 2013.
By employing the floating center-line oscillation analysis, it is immediately clear that RSI has not been oscillating to the high range during February-July. The slight move over the center oscillation line is still well below the normal oscillation for this stock. Not until the stock moves up in July does RSI oscillate, but it quickly goes to an overbought pattern, which drops quickly.
Volume has been steadily declining while the stock has been moving up out of its low. When volume is compared to RSI, it is evident that the downside price action dominates throughout this several-month period. Even as the stock moves upward, volume to the downside is significantly higher than the volume on the upside. The last few days of volume are lower overall, with weakness in all indicators.
RSI analysis conclusions for Visa: The move up from May-July has been dominated by smaller-lot investors, retail traders, and smaller funds buying while giant funds are quietly selling to lower their held positions. This is called rotation. By rotating out of one stock into another, the giant funds can choose better stocks for their particular portfolio. What the stock chart is showing is that the large lots are on the sell side and the small lots are on the buy side. The large lots prefer not to disturb price and so the orders have been carefully formulated to only sell as the stock moves up.
However, the most recent price action is exposing the fact that smaller-lot buying is less while larger-lot selling has remained consistent, putting more pressure to the downside. The weaker candles, declining Accum/Dist, MFI, and in particular, RSI and volume bars, clearly show that the rotation by large lots is starting to control the stock price at this point. Learn to use the RSI indicator in the upcoming online class at TechniTrader.com.
Trade Wisely,
Martha Stokes CMT
www.TechniTrader.com
info@technitrader.com