
Weekly Stock Discussion: Cisco Systems Inc. (CSCO)
Technical traders not only need to learn technical analysis, candlestick price patterns, and stock indicators, but they must also advance their analysis to asking why the stock price is behaving the way it is, who controls the price patterns that form, and what that means for near-term price action.
Technical Traders must also define whether the current price patterns are ideal for momentum trading, swing trading, or position trading. The preponderance of swing trading losses is due to the improper selection of stocks for that trading style.
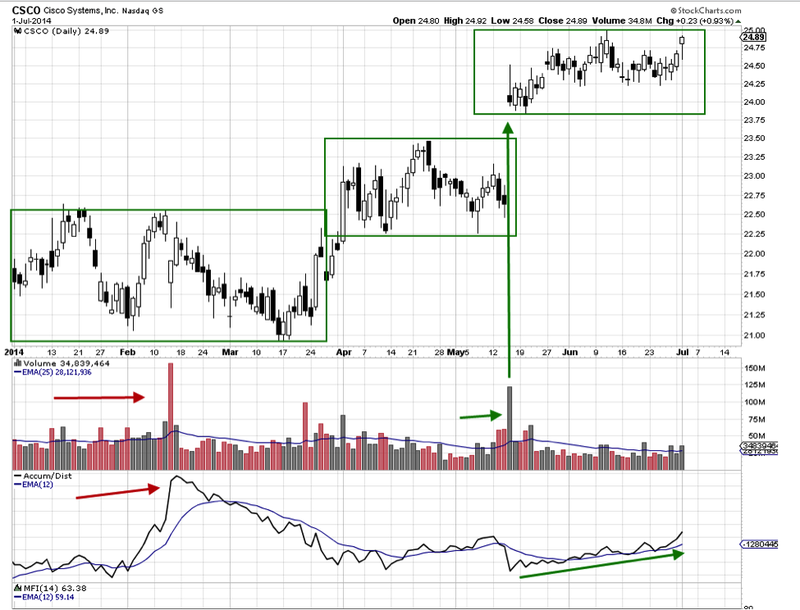
CSCO currently is not an ideal candidate for swing trading, even though it gaps frequently. The stock is moving in sideways price patterns that gap and then start another sideways pattern. There are three easy-to-see platforms shown in the green rectangles in the stock chart below. Each time CSCO breaks out and gaps up, the next platform pattern is tighter, more uniform, and more concise.
Only one of the nine market participant groups creates this type of platform sideways pattern, and that is the Dark Pool giant-lot and large-lot institutions buying for mutual funds or pension funds over an extended period of time. This type of sideways price pattern creates plenty of whipsaws for day or swing traders, who generally take losses on such price action, but it is ideal for Position Traders.
CSCO builds a platform and then High Frequency Traders (HFT) discover their buying and gap the stock upward. As the stock moves up in price, the platform is compressing, getting more uniform and tighter each time, and this occurs when there are more Dark Pool buyers. For Position Trading, the entry is low-risk with good upside potential over time.
However, swing traders trying to trade within the tighter price range would experience frequent whipsaws, shorter runs, and a higher risk of losses.
Position Trading is not as well-known as swing and momentum trading. Position trading takes less time, less capital, and it is ideal for busy people who are unable to spend all day watching stocks, or for people who would prefer a less stressful trading style that earns higher profits over time with far less risk than day trading or swing trading.
The volume spikes in the CSCO chart are caused by High Frequency Traders (HFT), but over the past two weeks, it has been showing the typical volume of Dark Pools buying into the stock incrementally. The one key thing to remember is that Dark Pool quiet accumulation does not move price. Therefore, using price and time indicators is not useful. Instead, switch to center-line volume oscillators, uptick/downtick volume or lot indicators, and accumulation indicators based on volume rather than price. These indicators will help the technical trader identify who controls the stock’s price patterns. In this instance,
Dark Pools control price while they accumulate. Once accumulation concludes, then the stock price may encounter another HFT run or gap.
Trade Wisely,
Martha Stokes CMT
www.TechniTrader.com
info@technitrader.com