
Monitoring purposes SPX: Neutral
Monitoring purposes GOLD: Gold ETF GLD long at 173.59 on 9/21/11
Long Term Trend monitor purposes: Flat
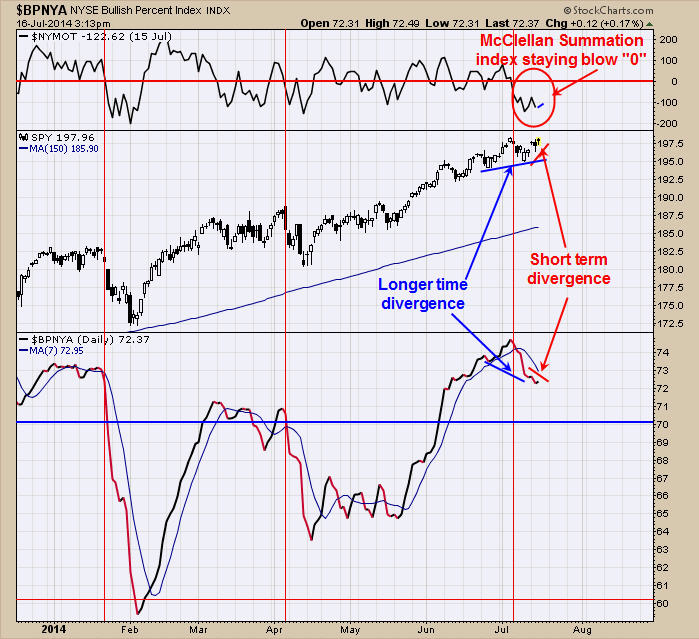
Timers Digest recorded the Ord Oracle report number 10 in performance for one year time frame dated July 12. We showed this chart yesterday and is updated to today’s trading. There is a large divergence that started in late June to about a week ago where the SPY made higher lows and the Bullish Percent index made lower lows. Since last Thursday’s low the SPY has pushed higher while the Bullish Percent broke recent lows. This condition shows that as the SPY was working higher there where decreasing buy signals generated by the Point and figure method show that less equity stocks carry the rally. This is option expiration week which normally has a bullish bias and market may hold up into Friday’s close. However if the current divergence stays into Friday then a pull back is possible next week. We have drawn red vertical lines on the chart above to show when the Bullish Percent index produced a bearish crossover. The current bearish crossover occurred on July 7 and is still on this sell signal.
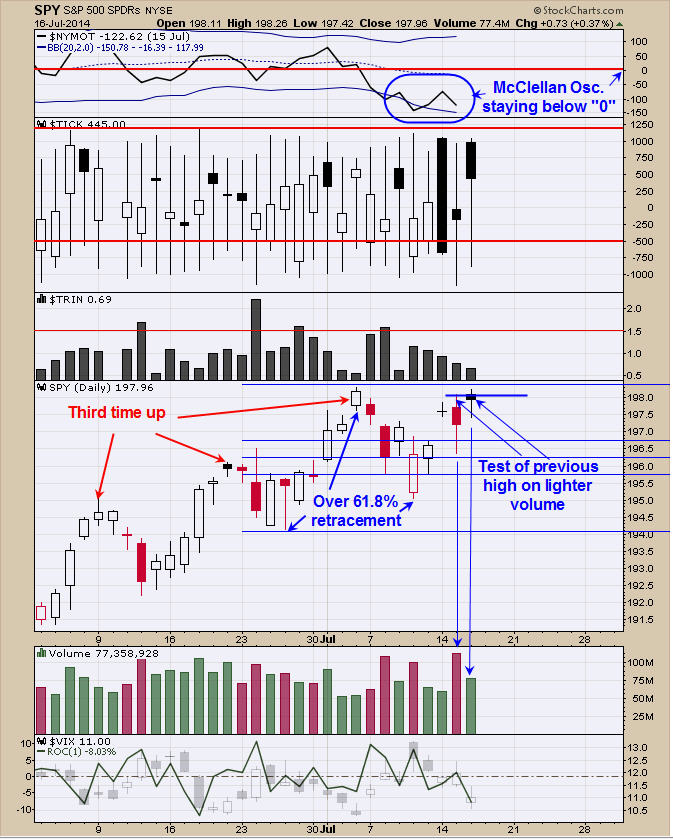
We shrank the time frame down to about a month and half so you can see more clearly the short term picture. Today’s rally tested yesterday’s high on lighter volume and than closed below the high producing a bearish “Upthrust”. The July 10 low retraced over 61.8% of the previous minor rally from the June 26 low. This condition suggests on the next rally up, the SPY should find resistance at the previous high, which appears to be happening. We also have the pattern “Third time Up” which suggests market should take a rest after the third top and that also appears to be happening. Market may hold up this week because of the Option expiration week but next week could see pull back down to the 192 range. We have cycle lows due on July 23 to 29 and may be where the next low will form. Still neutral for now.
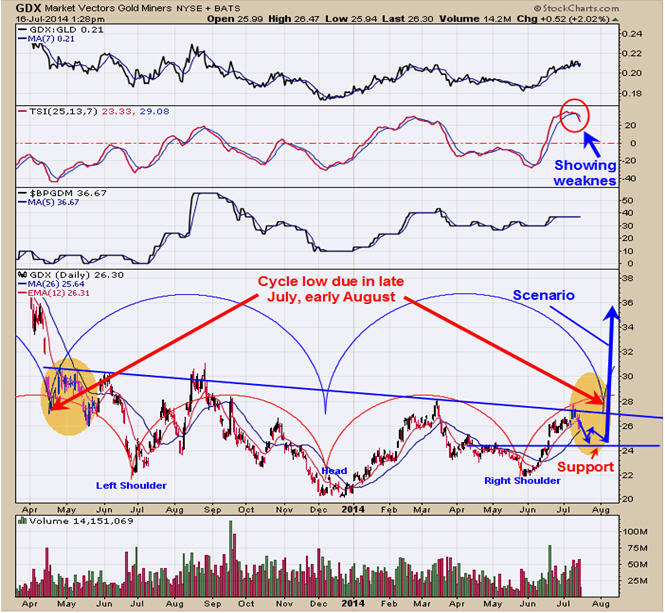
On Monday’s report, we showed that Large Speculators (dumb money) are in the largest long position in gold going back one year, while the Commercials (smart money) are in the largest short position in gold going back one year and a bearish short term sign for Gold and predicts a pull back. The chart above is GDX and shows the large Head and Shoulders bottom that so far is in play. To confirm this pattern a “Sign of Strength” is needed through the Neckline (near 27), which as not happen yet. We have drawn a blue semicircle which is a Cycle tool and helps with targeting the next swing. This Cycle tool gives a target in late July early August and a time zone we are keeping an eye on. The blue arrows represent are expected outlook. Support comes in near 24 and an area to watch for a bullish set on GDX. Staying neutral for now.
Tim Ord
Editor
www.ord-oracle.com