
Previously, I analyzed the 2000 and 2007-2008 market tops, along with the current market action. During all time periods, my trading system gave correct trading signals. This week, I am answering your question: our blue-line sell signal is around 1830 -- a 170-point difference from the current trading. Do you have a closer signal line for S&P 500 traders?”
To answer your question, I designed today’s chart exactly as the previous weeks, using the $SPX (S&P 500) from 2012 to the current (monthly) timeframe, with the SPX value in the top box and important momentum indicator in the lower box. I have my blue signal line front and center.
Let’s review. When the SPX crosses down and closes under a multi-month (green slotted) trend line plus crosses down through the blue signal line and trades under that value the next month, a sell signal is triggered. This system works for investors. Your question targets S&P 500 traders, so I added my traders (green slotted) signal line.
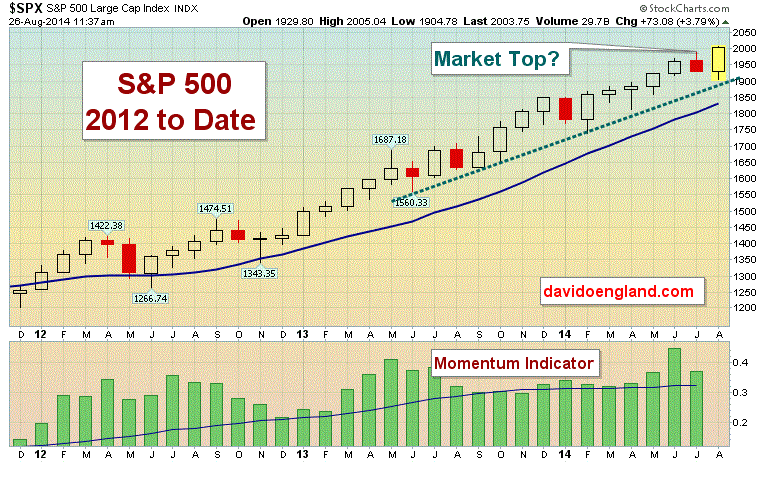
When the S&P 500 crosses under and closes under the traders’ (green-slotted) signal and multi-month trend line, this will be the signal many traders will use to capture some or all of their long position profits. I would also want to see the momentum indicator showing decreasing momentum. One can see the current action is still trading above both signal lines. In addition, last month many were calling the action a market top. Obviously, they were incorrect with their calls.
This is a prime example of what I teach, “Trade what you see instead of what you hear, feel or think!” In the last few months, I have read many reports that the sky is falling and one should be out of the market. If deciding to lock in some hard-earned gains, consider selling incrementally instead of all at once. This can keep money working for you in case the markets continue to rally. Be sure and review my previous columns for questions to ask before selling. Keep this chart front and center when making your trading decisions.
In addition, learn to chart your holdings to see how they are performing. Just because the market continues to rally does not guarantee all securities will continue to rally also. Many have experienced pullbacks/profit taking during this bull run. Make sure to review all investment holdings at least weekly and do not panic with the day-to-day action.
Keep in mind when studying the chart: in no way can they dictate 100 percent what will happen in the future. It only works as a guide for previous action. An exogenous event can come out of the blue to cause tremendous panic selling-something I hope does not happen.
Plan your work, work your plan and learn to share your harvest!
David O. England