
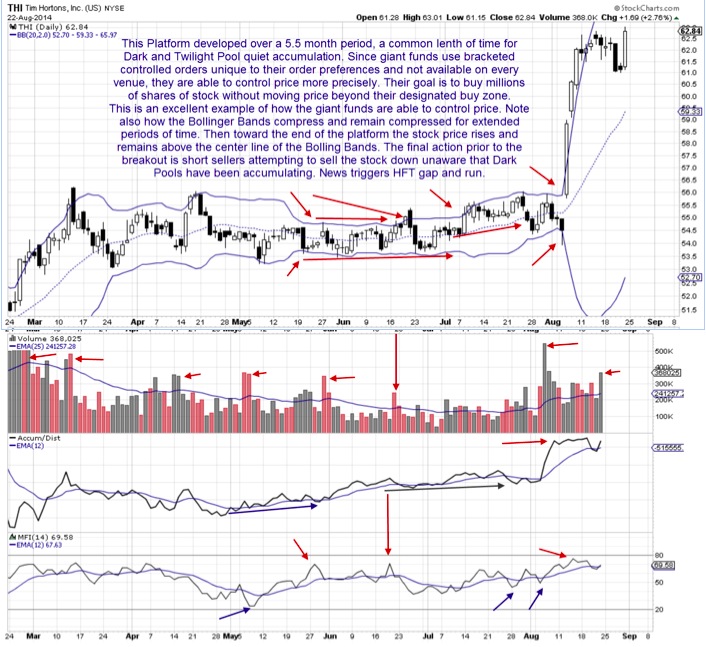
Below is a Daily Chart for Tim Horton, Inc. (NYSE: THI), which is in the restaurant consumer cyclical sector. This stock had a lengthy platform pattern. Using Bollinger Bands, several compression areas are exposed during the platform-development phase. Unfortunately, however, if only Bollinger Bands were used, technical traders would have encountered whipsaw trade action with potential losses. The red arrows show how Bollinger Bands compressed, and remained compressed, during the middle months of this intermediate-term quiet accumulation by Dark Pool giant funds. Numerous attempts to sell short this stock by short-term traders failed as the underlying buying power quickly overwhelmed the sell-short traders. Whipsaw action for short-term swing traders occured several times, as platforms tend to compress overtime and reduce the point-gain potential.
THI is a good example of how indicators and candlestick analysis need to be adjusted in order to accommodate new breakout strategies where Dark Pools are no longer working completely in the dark. Often, pre-market volume reveals order flow from giant-share lots and blocks. Misinterpretation by technical traders who attempted to sell short against that huge buying power, failed to move the stock down.
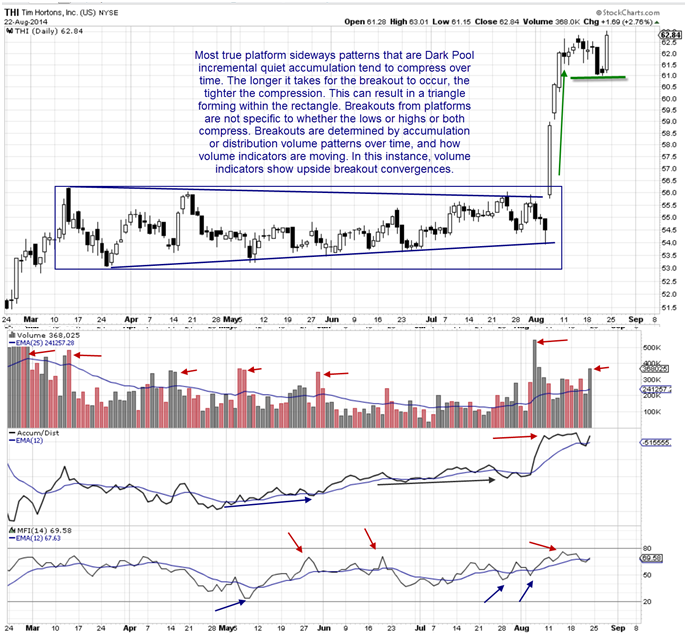
Bollinger Bands are useful whenever a stock has a lengthy sideways price action that develops over several months. However, by themselves, Bollinger Bands don’t indicate the direction the stock will take as it breaks out of the compression pattern. In addition, it is important to use trend lines in order to show the longer compression of price, which is harder to see with Bollinger Bands.
Professional Traders are currently busy creating new strategies and systems, as the entire market has prepared for far more sideways action, which will result in breakout runs, gaps, and velocity action. Professional traders are anticipating that the breakout strategies will be the best for the fall and winter activity. This is due to three changes in the market structure:
1. The SEC ruling on the 5-cent spread for small-cap stocks.
2. The SEC ruling on Maker-Taker rebates.
3. New regulations and compliance requirements for proprietary desk trading.
As the market structure continues to evolve at an unprecedented pace, with far more regulatory influence, significantly more risk-assessment model usage, and changes to the overall structure of the market participant groups, professional traders are starting to determine how to best deal with how these changes will impact technical patterns and their trading activity.
Technical traders can reap huge benefits by following the lead of the professional, seasoned proprietary desk trader and independent professional traders. By elevating technical analysis and trading processes to the semi-professional level, even retail traders can learn how to enter a stock sooner and exit a stock prior to profit-taking.
THI is a good example of a lengthy sideways pattern called a “platform.” Platforms are a specific sideways pattern which develops over extended periods of time, often 3 months in duration. These platforms are a newer sideways pattern that has evolved in stock charts due to the increased usage of Dark Pools and Twilight Pools, Pre-Market Block Trading, and other venues which allow the giant and larger Buy-Side Institutions to accumulate millions of shares of stock over time.
Since most giant Buy-Side Institutions make fundamentally-based buy or sell decisions, their buying or selling tends to commence immediately following the close of the earnings season, in anticipation of the next earnings quarter results. While Bollinger Bands are excellent for finding compressing platforms, the bands do not properly indicate the direction of the breakout, which often causes traders to take the opposing position against the Dark Pool institutions.
Flow-of-funds indicators, volume oscillators, and accumulation indicators assist in proper analysis of the direction of the breakout. HFTs trigger on news that smaller funds, foreign funds, and sovereign funds then chase.
Understanding the undercurrents of Dark Pool quiet accumulation and how that pattern appears on stock charts will help technical traders avoid being on the opposite side of the transaction when Dark Pools are buying or selling.
Trade Wisely,
Martha Stokes CMT
www.TechniTrader.com
info@technitrader.com