
Trading Range Analysis of Stock Price Action in Wal-Mart Stores Inc. (NYSE: WMT)
Many big blue chip stocks are stuck in intermediate or long term trading ranges, which are more difficult to see on a daily chart with a 6-9 month setting. Increasing the timeframe to 2 years still doesn’t provide the detail necessary to determine the direction in which the breakout will occur.
Trading Ranges typically have inconsistent highs and low or peaks and troughs. A Trading Range is merely a Peaks and Valleys Trendline pattern that has shifted sideways. The inconsistency of the high and low price levels of the sideways range make these patterns more challenging to analyze. The daily chart is often cluttered with too much day-by-day volatility because in a trading range, neither buyers nor sellers dominate sufficiently to move the stock into an uptrend or a downtrend. The stock price remains stuck in the range due to fundamental and technical resistance and trading activity without leadership.
An easier way to glean more information from the stock chart is to use weekly charts for the analysis of trading ranges. This time frame can help a trader ascertain the likely length of time the stock will remain in the trading range and the all-important direction that the stock will take out of the trading range.
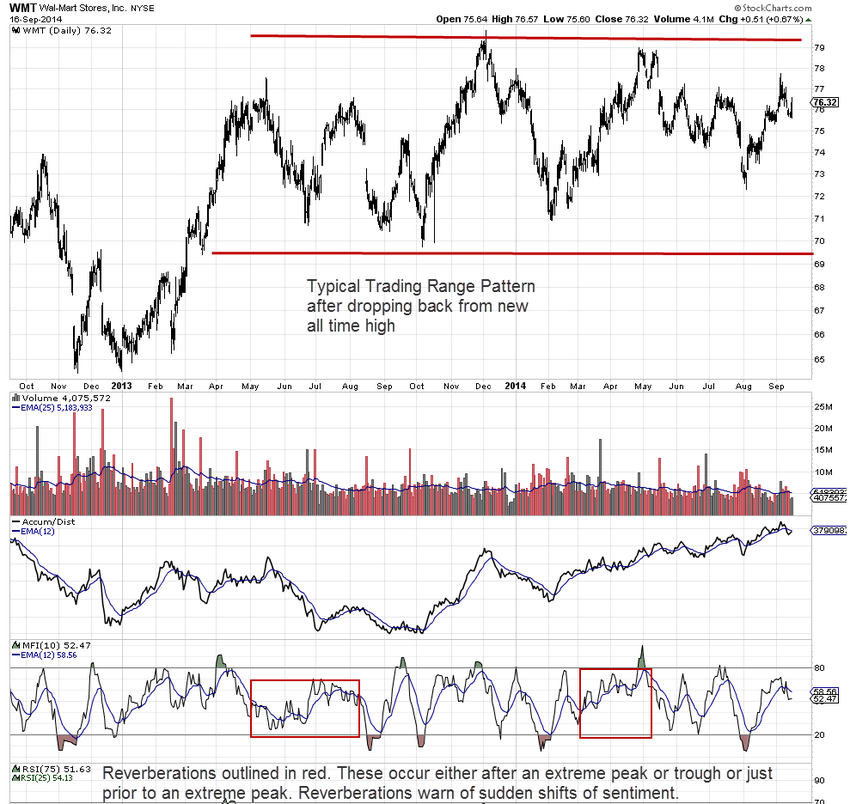
The WMT chart above is a daily chart and the noise of the daily activity gives frequent signals that are not reliable for determining breakout direction or how long the range is likely to continue. The cyclical pattern to this trading range is evident and fairly precise as cycles go. It is most easily seen in this chart with the MFI indicator. Reverberations within the cycle have occurred at key areas prior to reversals. Reverberations are similar to aftershocks. They are important to recognize in trading ranges, which often change direction at varying levels within the range. Intra-level peaks and valleys are more vulnerable to reverberations.
Weekly charts, such as shown below, eliminate the chatter and choppiness while maintaining the volatility within the chart.
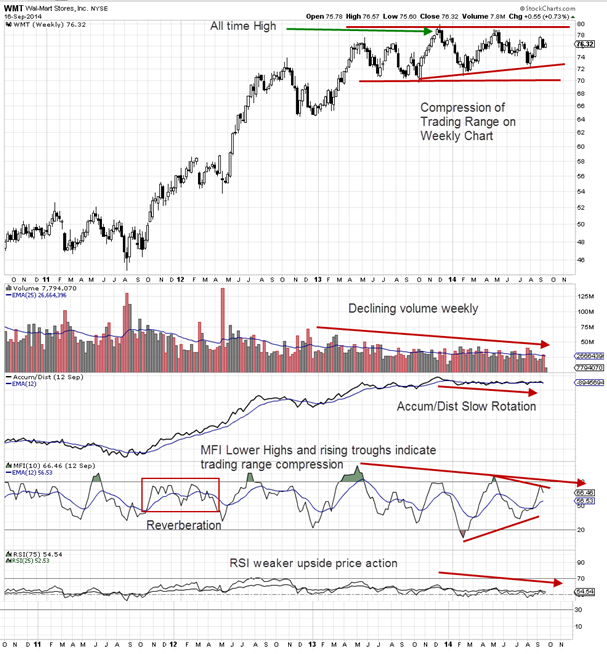
This WMT weekly chart clearly shows the trading range in a compact format that exposes the trading range action well. There is also evidence of a compression of the trading range from the lows of the trading range price action.
Weekly volume has been steadily declining, as is common when smaller lots are buying. MFI is showing lower peaks or highs over time and the Accum/Dist indicator shows slow quiet rotation. Rotation is not distribution but a milder form of lowering held shares in Charter and Trust stocks. Basically, the weekly chart shows that smaller lots and small funds are buying in the trading range while giant funds are quietly lowering their held shares without impacting the stock price, as they do very well. The trend continues with High Frequency Trading and some pro traders trading the short-term runs within the range. Dark Pools tend to sell into rising price in a trading range. This maintains the sideways trading range.
The short RSI has dropped below its oscillating center RSI line which indicates that the current price action is weaker compared to the prior week’s price action. When used correctly, RSI is a unique price and time indicator due to the relational analysis it provides to expose weakness in sideways price action that is difficult to see otherwise.
This trading range is incomplete and could potentially continue for a quarter or two. It is based primarily on fundamental resistance rather than technical resistance at this time. Rotation is mild but if it accelerates or increases in quantity, this could shift the currently sensitive balance between giant lots quietly rotating and smaller lots buying on perceived “dips”.
A significant shift of sentiment is needed to move the stock to a breakout to the upside.
Trade Wisely,
Martha Stokes CMT
www.TechniTrader.com
info@technitrader.com