
$NTAP Bottom Formation Setting Up for Swing Style Price Action
Swing trading, whether used intraday or for daily runs, requires an understanding of the relationship between the trading conditions at that time and the price patterns developing on the chart being traded. Swing traders should never use percentage stop losses, as these are part of the High Frequency Trading Algorithms that search for cluster orders to exploit. Instead, swing traders should identify the proper support levels from technical patterns.
Support levels for swing trading should provide sufficient support for the length of time the swing trade will be held as well as whether the stock is in a momentum run or a velocity run. Each type of swing-style run requires a different stop loss support level.
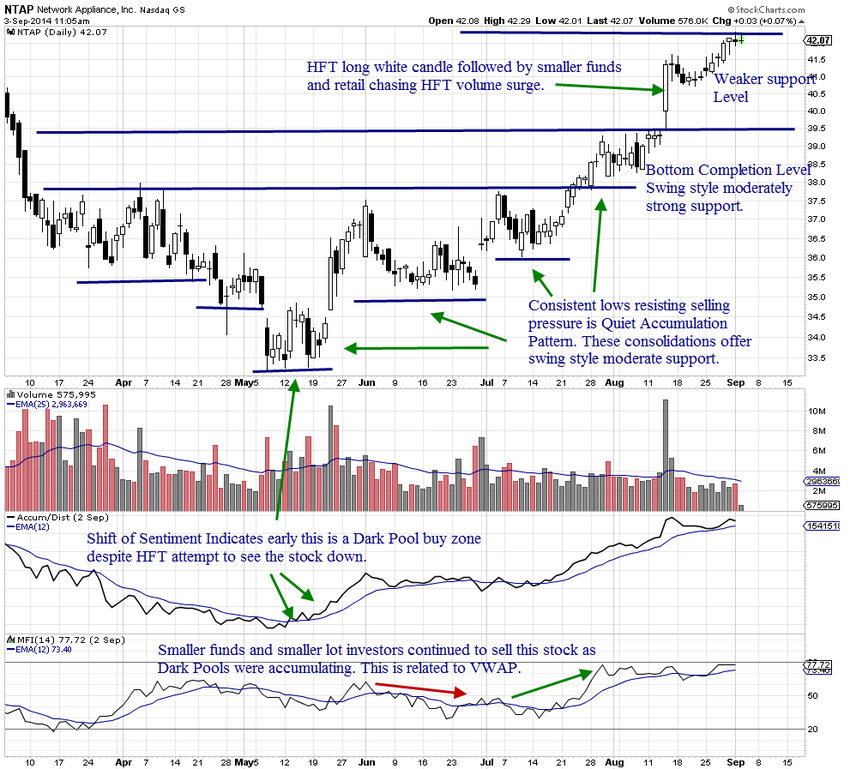
As an example, Netapp Inc. (NASDAQ: NTAP) completed a bottom formation in August by moving up and sustaining the gains of the breakout pattern. At the time the chart was captured, the stock was resting just below moderately strong resistance seen best on a weekly chart.
Momentum vs. Velocity Runs
Momentum runs have pauses in the swing-style run. These pauses are reflected in both price and volume. Resting-day patterns allow the momentum run to sustain longer than a velocity run. However, since these resting days can have candles with long wicks and tails, avoiding a whipsaw due to a tail momentarily hitting a stop loss level is crucial to not being taken out of the momentum run too early.
Velocity runs do not have resting-day patterns and require a much tighter stop loss using intraday support levels.
Identifying whether the run is a Momentum Run or a Velocity Run is important. This information comes from the prior runs of the chart. Since certain types of stocks appeal to specific groups of traders, the patterns tend to repeat in a similar manner over time. NTAP is a momentum run stock chart. Those who trade this stock frequently are using momentum-style trading both intraday and in daily run trading.
In January, a momentum run with a vertical angle of ascent triggered heavy profit-taking. The momentum run candles overlap, requiring a stop loss that takes the overlapping candle patterns into consideration. During the bottoming formation, runs continued to show the typical momentum, pause, momentum run pattern.
This is also a stock that has huge “news interest” which frequently triggers the automated orders of High Frequency Traders, HFTs. This is seen in the volume spikes that occur often on this stock chart. The bottom formation reveals, in both price and accumulation indicators, that Dark Pools were quietly accumulating this stock during the late spring and early summer when HFTs were less active.
Since HFTs are very active normally in this stock, it is a good candidate to watch for a potential swing-style momentum run after it clears the moderate resistance level from the 4th quarter of 2013.
Stop losses must be placed below the resting-day consolidations and take into consideration the length of the average tails that form when the stock is moving sideways. Momentum swing trades require frequent moving of the stop loss as the stock runs with momentum upward.
For now, the stock is pausing to gather momentum.
Trade Wisely,
Martha Stokes CMT
www.TechniTrader.com
info@technitrader.com