
Monitoring purposes SPX: Sold long SPX on 8/14/14 at 1955.18 = gain 2.39%. Long SPY on 8/7/14 at 1909.57.
Monitoring purposes GOLD: Gold ETF GLD long at 173.59 on 9/21/11
Long Term Trend monitor purposes: Flat
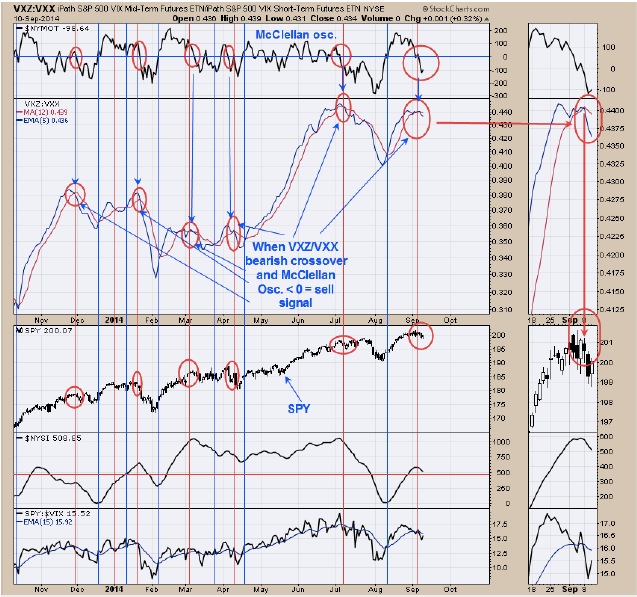
We use multiple indicators that give buy and sell signals as not all indicators work all the time. We have two unrelated indicators on page one and two and both are showing a similar signal. Above is the VXZ/VXX ratio. The VXZ is the VIX mid term and the VXX is the VIX short term. This ratio helps to define the trend for the SPY. It’s a two part signal, where the McClellan Oscillator needs to be below “0” and the VXZ/VXX ratio to cross down through its 15 period moving average to trigger the sell signal. We have circled in red all signals of this type going back to October 2013. This method is currently on a sell signal. On page two another signal method is used. Staying neutral for now.
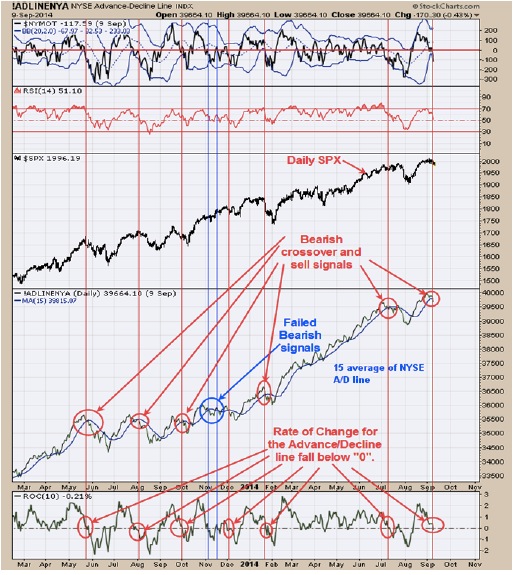
The above chart is the NYSE Advance/Decline line with a 15 period moving average. The bottom window is the Rate of Change (ROC) of the NYSE Advance/Decline line. A short term bearish signal is triggered when the NYSE Advance/Decline line closes below its 15 period moving average and the ROC of the A/D line closes below “0”. A bearish signals was triggered yesterday on this indicator. This type of indicator does work well but not all the time as the two blue verticals lines in November of last year where failed sell signals. Today the SPY bounced off the 199 July high however, we did not see a panic reading in the TRIN above 2.00 over the last several days to suggest the 199 has support. According to the TRIN readings, there appears no support forming here. If the market is going to pull back it should do it this week as next week is option expiration week which normally has a bullish bias and we have a cycle low due Thursday which is 9/11/14.
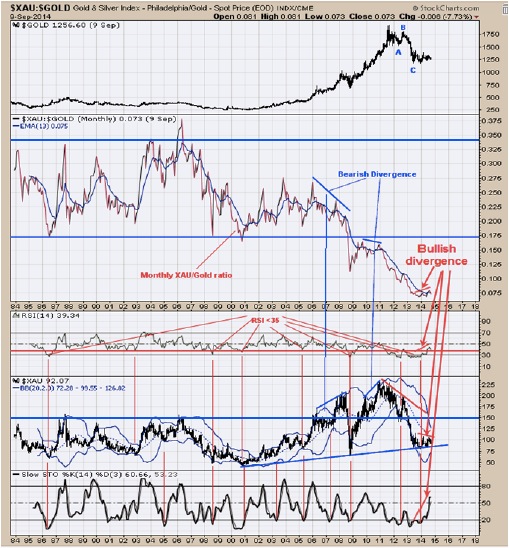
The chart above is the monthly chart for XAU going back to 1984. A bullish long term signal is triggered for the XAU when the monthly RSI of the XAU/Gold ratio turns up from below 35 and the monthly Slow Stochastics for the XAU/Gold ratio turns up and closes above 20. The red vertical lines on the chart show when these bullish signals where triggered on the XAU. The last bullish signal occurred in December 2013 and remains on this bullish signal. Though XAU has not done much from last December there are long term bullish divergences. For instance, the XAU has made a lower high since last January but the RSI, XAU/Gold ratio and slow stochastics all made higher highs which suggests the XAU is showing internal strength and therefore the longer term picture looks promising. However for short term we haven’t found the next low yet and the COT commercials are still at a short term bearish slant from last Friday’s report. Next intermediate term low in XAU (and GDX) may be not far away.
Tim Ord,
Editor
For free 30 day trial just send us your email address to tim@ord-oracle.com.