
Monitoring purposes SPX: Sold long SPX on 8/14/14 at 1955.18 = gain 2.39%. Long SPY on 8/7/14 at 1909.57.
Monitoring purposes GOLD: Gold ETF GLD long at 173.59 on 9/21/11
Long Term Trend monitor purposes: Flat
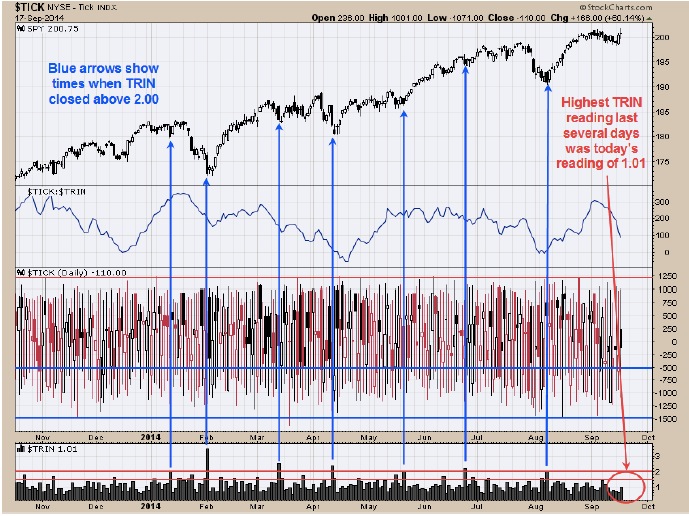
The chart above shows the TRIN closes going back about one year. The blue arrows show when the TRIN closes above 2.00 which is a bullish sign for the market. About in every case when the TRIN closed above 2.00 the market was near a bottom. There where a low in December 11, 2013 that had an TRIN close of 1.62 but the TICKS on that day closed at -718 and enough of panic readings in both TRIN and Ticks to suggests a short term bottom. Over the last several days neither the TRIN nor the TICK reached panic levels and suggests the current bounce will not be lasting. Most likely the low on Monday will be at least tested and the gap near 196 on the SPY could still be tested, just depends where the Panic will show up for the next bottom to be identified. We are expecting more consolidation in the near term.
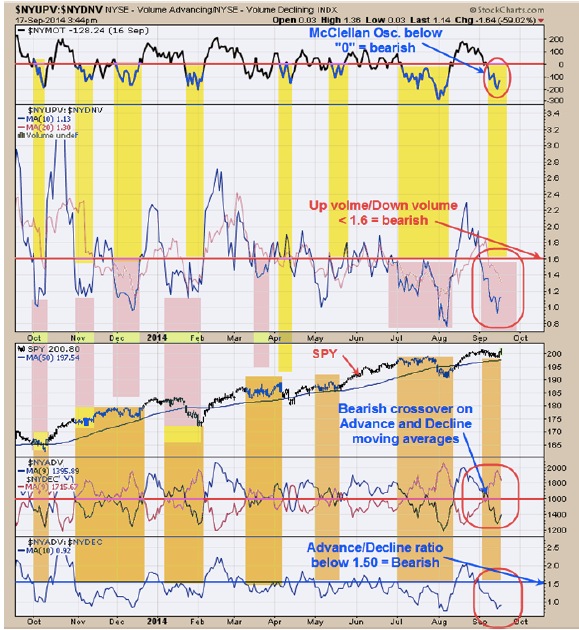
Above is four indicators that help judge the condition of the market. The top window is the McClellan Oscillator and readings below “0” are considered bearish. Today’s reading will come in near -100 and in bearish territory. Next window down is the Up volume/Down volume ratio and readings less than 1.60 are considered bearish. Today’s reading came in at 1.13. Next window down is the Advance and decline moving average. A bearish crossover occurred in early September and remains on a bearish crossover. The bottom window is the Advance/Decline ratio and readings below 1.50 are considered bearish. Today’s reading came in at .92. We are not thinking a large decline is beginning here but rather market is going to have a difficult time trying to go higher. We also have done studies in the past where there was no panic in the TRIN or Ticks and vast majority of the time the market went down again and produced the panic before the real rally began. We are expecting the current consolidation to continue and a panic low to show up at the final bottom.
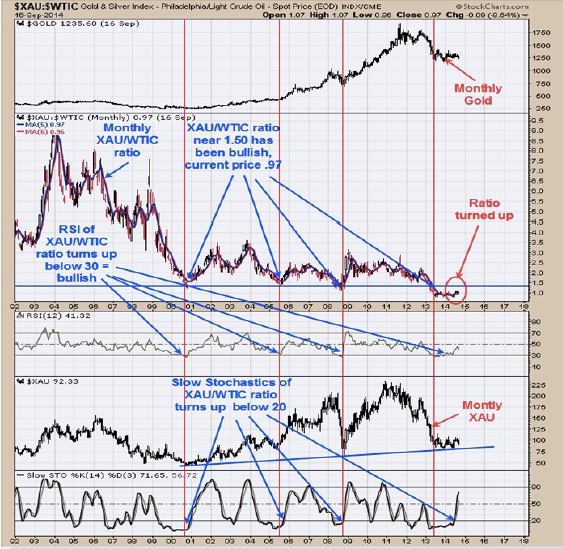
The chart above is the monthly XAU/WTIC ratio and the RSI and Slow Stochastics is on the XAU/WTIC ratio. The XAU is a gold stock index and the WTIC symbol is for the Philadelphia Light Crude Oil. Long term bullish signals have been triggered for the XAU when the monthly RSI for the XAU/WTIC ratio turned up from below 30 and the monthly Slow Stochastic for the XAU/WTIC ratio turned up from below 20. We have marked these conditions with vertical red lines. Looking back this method picked out the bottoms of 2000; 2005; 2008 and a bullish signal were triggered back in mid 2013. Since the mid 2013 signal not much has happen but the XAU in general quit going down and more or less has gone sideways. Notice that on the XAU/WTIC ratio that the previous bullish signals where generated at the 1.50 level and the current signal was generated near 1.00 level.
Does that mean the current signal will be stronger then the previous signals? We will have to wait and see. It does appear that the XAU rally starts when the XAU/WTIC ratio turns up and that has happen over the last couple of months and suggests a bullish run for the XAU has started for the longer term. However the short term picture is a little muddled and the consolidation may not be complete. Setting on my hands for now.
Tim Ord,
Editor