
Monitoring purposes SPX: Sold long SPX on 8/14/14 at 1955.18 = gain 2.39%. Long SPY on 8/7/14 at 1909.57.
Monitoring purposes GOLD: Gold ETF GLD long at 173.59 on 9/21/11
Long Term Trend monitor purposes: Flat
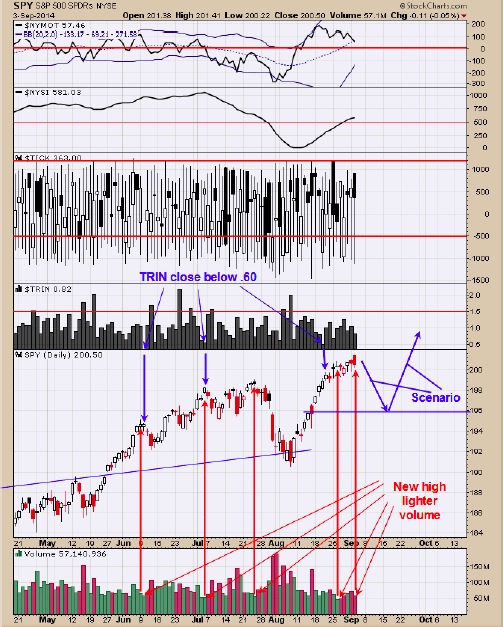
Today the SPY hit a new high on lighter volume and than closed lower. With red arrows we marked the times where the SPY hit a new high and volume dropped and in each case the market at least pull back for two days. We also point out in blue arrows where the TRIN closed below .60 which implies short term exhaustion in the market. The TRIN closed at .50 on 8/20 and market has pushed higher from then but not by much. September 11 is next Thursday and there is a cycle low due then and market could pull back to that date. There is an open gap near 196 and its possible that a pull back could find support there. Bigger trend is up and new high could be seen after this potential pull back is completed. Staying neutral for now.
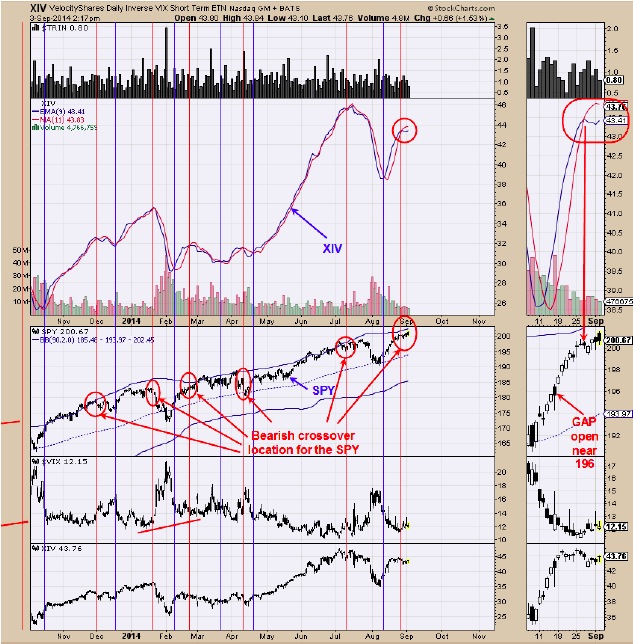
The chart above is the XIV with moving averages of 9 and 11 periods. The XIV is the inverse of VIX. We have circled in red on the SPY chart where the XIV had bearish crossovers. In general the bullish and bearish crossovers on the XIV have triggered timely signals for the SPY. On August 27 the XIV produced a bearish crossover and remains on a bearish crossover even though SPY has moved modestly higher. Market is struggling here but still holding up. Yesterday we showed the VXZ/VXX ratio which is nearing a bearish crossover but has not actually crossed yet. Bigger trend is up but short term trend is in question and a short term pull back in SPY near 196 is possible. Sold long SPX on 8/14/14 at 1955.18 = gain 2.39%.
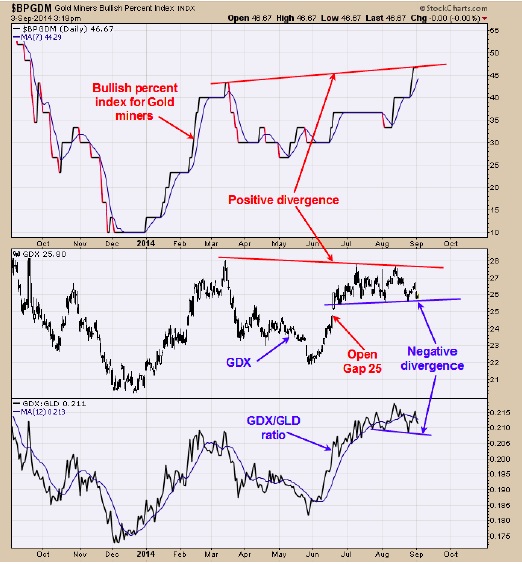
Commitment of Traders report (COT) are posted on Friday’s and the Commercials, which are considered the “Smart Money” are on a bearish slant for gold and usually have the correct direction in the gold market. The top window is the bullish percent index for the Gold Miners index. The Bullish percent index measures the percent of buy signals using the Point and Figure method in the Gold Miners index. As you can see on the chart above the Bullish Percent index hit above the March high and shows that there are more buy signals now then in March and shows this market is getting stronger. The bottom chart is the GDX/GLD ratio. In general when this ratio is rising than that is both bullish for gold and gold stocks and vice versa. Since early August this ratio has made lower lows where GDX has made higher lows and a short term bearish condition for GDX. The COT Commercials are on a bearish slant and GDX/GLD ratio showing a bearish short term slant and suggests the short term picture is weak. There is an open gap near 25 and a possible short term target. The XAU monthly charts are on buy signals and therefore the next bottom could be a lasting bottom. We are staying neutral for now.
Tim Ord,
Editor
www.ord-oracle.com