
Reading A Chart’s Support And Resistance Levels Requires More Analysis Than Price Patterns
This week’s stock discussion is regarding Avis Budget Group, Inc. (NASDAQ:CAR) a mid-cap stock, with how support levels vary according to which market participant group dominated during the sideways action.
Support is usually a sideways pattern, but occasionally support can also be found using a moving average IF the stock is in a Peaks and Valleys Trendline pattern. However the new order systems used by 80% of the market which is the professional side, have altered how price patterns develop which creates more sideways patterns than trending price action.
Professional, proprietary desk, and independent technical traders are returning to the market as a shift away from speed is replaced by quality trading, which only a human professional trader can do. These pros are currently discussing how to handle the new patterns that form most often in the global marketplace where non US small funds, sovereign funds, non-profits, and many other types of mutual and pension funds are trading the US market more than at any time previously.
Since the Institutions control about 80% of all order flow and most are automated, which is not the same as a High Frequency Trading HFT order, the patterns that develop for support on charts have altered. Pros are now gearing up for far more sideways action by creating new strategies that work in a slower paced market expected next year.
Technical support levels form frequently and are unrelated to Fundamental support. Technical support is weaker support, usually used by day, swing, sell shorters, as well as other short term trading styles and most trading strategies.
Fundamental support is also visible in the stock charts but has far more impact on price, especially during a sudden Velocity driven deep Angle of Descent as we have seen recently. When a stock drops vertically with velocity price action, it is critical to differentiate Technical support from Fundamental support.
Technical support is usually weaker and creates bounces and buy-to-cover price action. Fundamental support always includes the risk of a reversal with sudden momentum upside action, due to Dark Pool Bargain Hunters setting orders in their previous buy zone that simply trigger as the stock drops deep into the Fundamental support area.
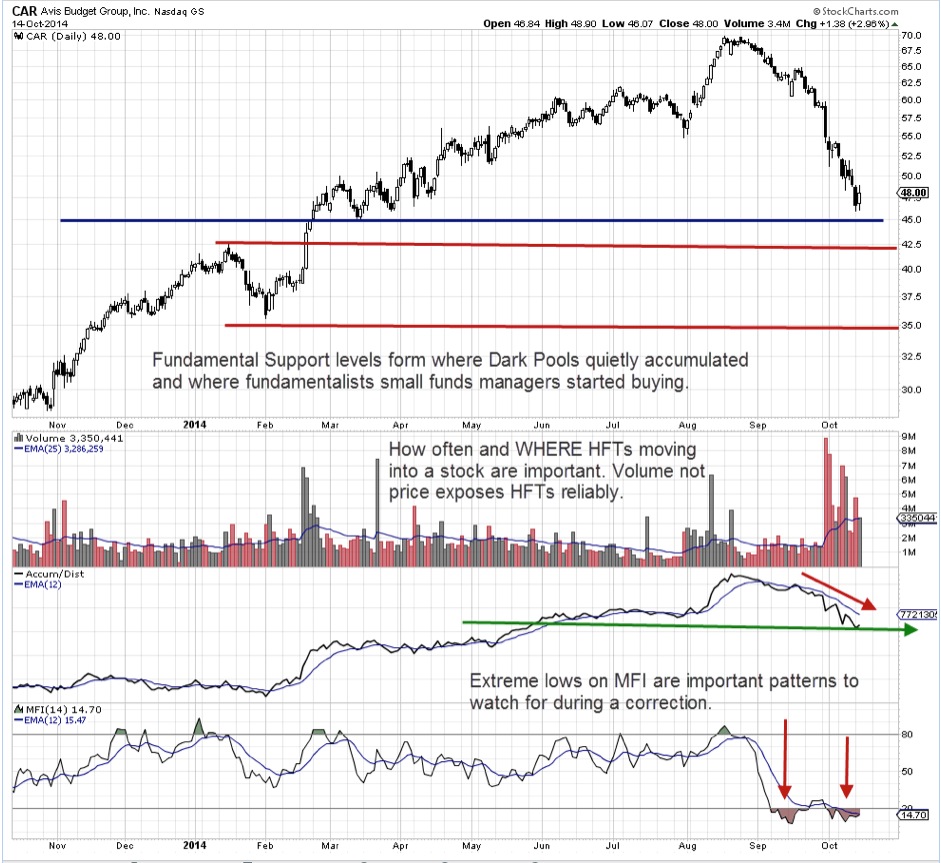
CAR is one of numerous examples that show the risk of Fundamental support, which is defined by both the lowest red line and the red line below the current price action. Money Flow Index MFI is an excellent
indicator to identify extreme patterns for volume to the downside, that often precede a reversal or sudden move up. Identifying HFT volume on Volume Bars is also a crucial element in analysis, of where the stock is at highest risk of commencing a bottom. The stock fell rapidly, much faster than it moved up. The huge volume was HFT driven with Volume Weighted Average Price VWAP automated orders chasing after them, so the risk that this stock could potentially have a sudden big run up increases as it nears the Fundamental support levels.
Often times, individual traders and technical traders are so immersed in trading during a downtrending market, that they fail to watch for the telltale signs of Fundamental support. This means their selling short is higher risk than they may believe.
When the stock reverses to a rally out of the bottom, most individual traders and technical traders are taken by surprised. Incorporating Fundamental indicators and support analysis into the interpretation of price action, can significantly improve your ability to switch gears faster and move in sooner as a stock runs up after a deep correction.
Trade Wisely,
Martha Stokes CMT
www.TechniTrader.com
info@technitrader.com