
Microsoft (NASDAQ: MSFT) Stock Chart Shows Why Watching Volume Pays
Volume has become one of the most important indicators, as Dark Pools took liquidity off the exchanges and market-maker limit books while High Frequency Trading seized control of the void the giant lots left behind.
Although most retail traders who started learning to trade back in the mid ‘90s were told that volume was not important and that price indicators where what they needed to learn to use, nowadays the trader who doesn’t use volume is learning the hard way why it is so important.
HFTs cause huge volume spikes called Volume Exhaustion Patterns. These huge extraordinary volume days often do not move price much, if at all. HFTs trade heavily in the first few minutes of the day, and then most big blue chip stocks experience very low volume for the remainder of the day.
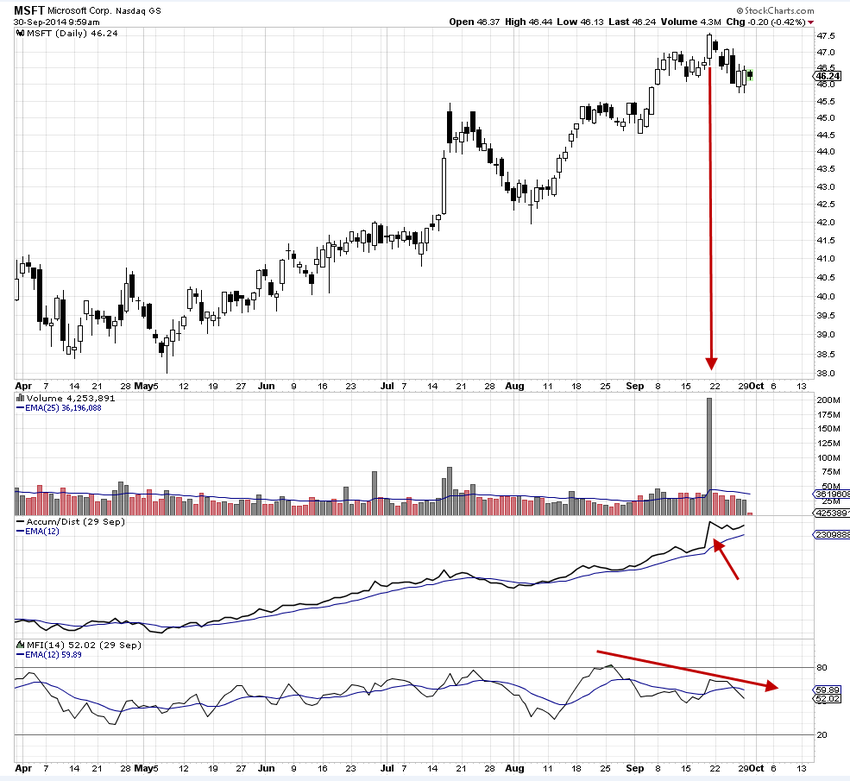
MSFT is not heavily traded by HFTs as are many big blue chip stocks that are frequently in the news, which means when HFTs are triggered by news about MSFT, volume spikes are easily identified on the stock chart.
What is critically important for short-term retail traders to use in their analysis is the fact that Volume Exhaustion Patterns that do not occur frequently on some stocks are most often warnings that the run is nearing or at an exhaustion level. A volume surge of this magnitude often warns that the run is losing, not gaining, momentum.
Many small fund managers started using VWAP-type entries a few years ago and these types of professional orders tend to trigger after the HFT Volume Exhaustion Pattern. However, their buying capital is limited and rarely are there sufficient numbers of small funds and retail traders or investors to move price up strongly.
This is due to the fact that most professional human traders have quickly identified the Volume Exhaustion Pattern that retail traders miss entirely. By using the Volume Exhaustion Pattern as a signal, professionals start selling for profit. This causes a shift of sentiment with large-lot pro traders selling against smaller-lot buyers. HFTs are long gone and no longer contribute liquidity, so the stock tends to slip-slide down as profit-taking large lots overwhelm the small-lot buyers.
Watching for HFT volume spikes during a swing momentum or swing velocity trade can help retail traders exit with their professional counterparts and lower the risk of losing profits when exiting too late.
With over 80% of all the market activity now fully automated, and with the Dark Pools’ ability to control price in a tight pattern, using volume histogram analysis has become a necessity for retail traders.
It is no longer enough to just use price and time indicators because often price doesn’t move until after Dark Pools have accumulated or distributed and, by then, it is too late for the retail trader to enter and enjoy a strong swing-style trade point gain.
Also, retail traders are often caught by surprise, entering what appears to be an ideal swing trade due to a MACD signal triggered by the price moving up on a day of HFT-driven Volume Exhaustion Pattern, as occurred in the MSFT stock chart, which then results in a minor retracement down.
Summary:
Volume Exhaustion Patterns are important indications of an increased risk of a reversal, profit-taking or weak follow-through in price action for swing traders.
Truncating volume bars has become a common practice, which eliminates the visual Volume spike warning that the volume of the trading activity has reached an exhaustion level and the following day’s price is at risk of a reversal.
Incorporating Volume Exhaustion Pattern analysis is simple and quick, while adding substantial benefit by helping traders avoid whipsaw or reversal price action in swing and day trades.
Trade Wisely,
Martha Stokes CMT
www.TechniTrader.com
info@technitrader.com