
Monitoring purposes SPX; Sold 9/30/14 at 1972.29= gain .003%; Long SPX on 9/25/14 at 1965.99.
Monitoring purposes Gold: Gold ETF GLD long at 173.59 on 9/21/11.
Long Term Trend monitor purposes: Flat
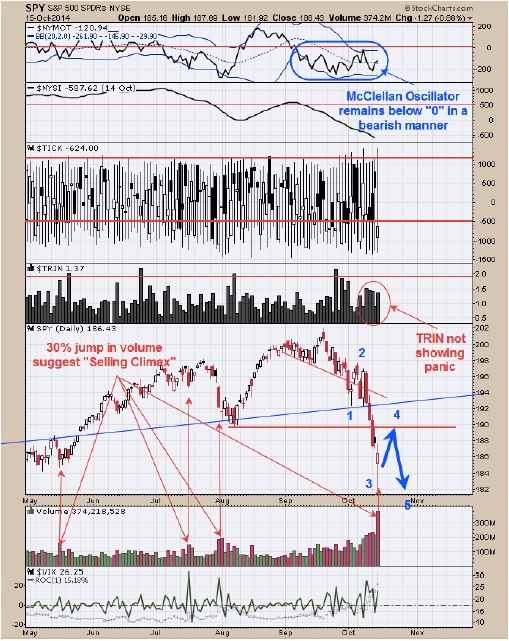
Today volume on the SPY jumped over 30% from the previous days and suggesting a “Selling Climax” was triggered today. On the chart above we have labeled previous days where volume jumped over 30% and in each case the market was near a low. Most “Selling Climax” lows are tested and would expect today’s low to be tested before a worthwhile rallies starts. Also notice that the “TRIN” has not reached panic levels >2.00 to suggests a bottom is forming here. Ideally we would like to see today’s low tested on much lighter Volume and for the TRIN to close above 2.00 on that test to trigger a decent buy signal. We do have cycle lows do on the week of October 27 and a time to look for a low. Again this is option expiration week which usually has a bullish bias but potential rally could be just an Elliott Wave 4 that may find resistance near 190 range. The bottom of wave 5 could test the April low near 180 which is about 2 points below today’s low. Staying neutral for now.
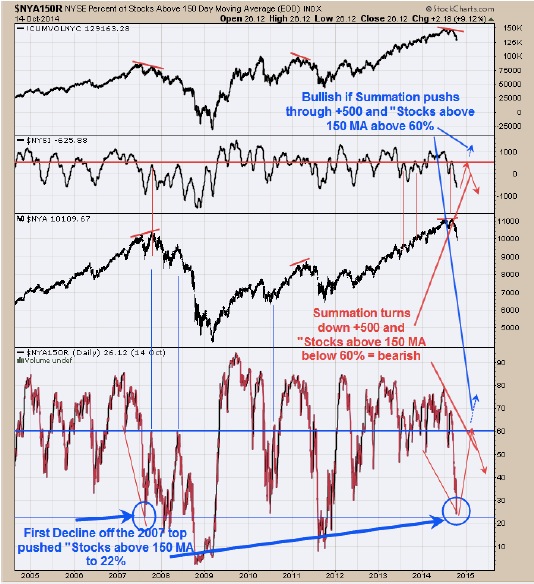
Its interesting to note that the first decline off of the 2007 top pushed the “Stocks above 150 day moving average” to 22%. Meaning there where only 22% of the stocks in the NYSE where above its 150 day moving average. Current reading is 26.12% and we believe the total decline is not done yet and when it is the Percent of stocks above its 150 day MA may be close to 22% or maybe less. So there are similarities that are starting to appear between the 2007 to and the current top. However, none of that will matter if the next rally is strong and pushes the “Stock above 150 AM” way above 60% is a show of strength and which will negate the bearish picture. The second window down from the top is the McClellan Oscillator. It to needs to push above +500 on the next rally ot negate is bearish picture. Today’s decline looks like a “Selling Climax” and most “Selling Climax” have a test of its low before a bullish setup can be identified. We will see what setup the test provides.
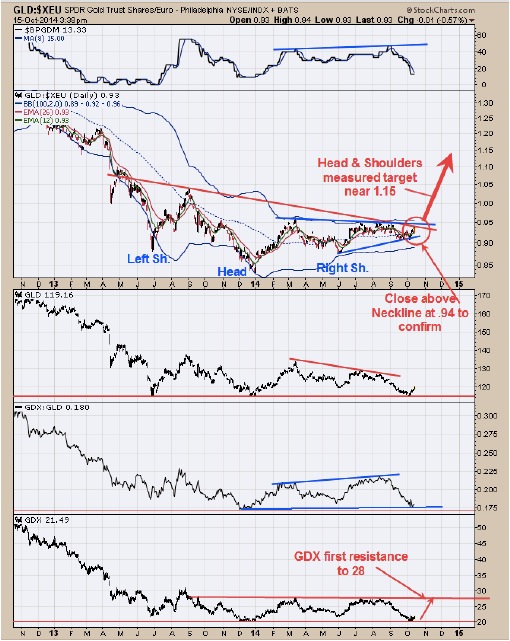
The GLD/XEU ratio appears to be drawing a bullish Head and Shoulders bottom on a large scale where the Head is the January 2014 low. To confirm this pattern a “Sign of Strength” is needed through the Neckline (.94 range) which this ratio is moving towards. If a break above .94 does occur with a “Sign of Strength” it would have a target to near 1.15 level. If the break does materialize that would be bullish for gold stocks and Gold/$. We did get a buy signal yesterday on GDX (long 21.47) using shorter term technical’s and would have a measured target to the previous high near 28. Long GDX at 21.47 on 10/14/15.
Tim Ord
Editor