
Monitoring purposes SPX: Sold 9/30/14 at 1972.29= gain .003%; Long SPX on 9/25/14 at 1965.99.
Monitoring purposes GOLD: Gold ETF GLD long at 173.59 on 9/21/11
Long Term Trend monitor purposes: Flat
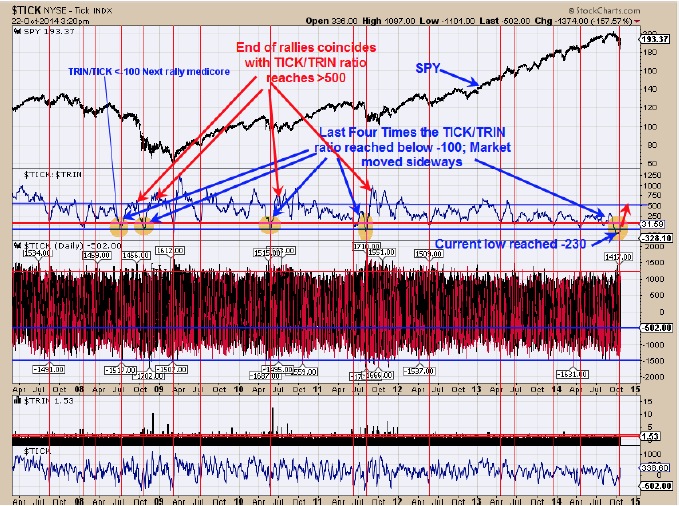
The top window is the SPY and the window below that is the TICK/TRIN ratio. When this ratio stalls out near +100 than in generals everything is OK internally in the market and the market is expected to move higher if not break to new highs. When the TICK/TRIN ratio moves to -100 or lower (recent low hit near -230) than market moved sideways (more or less). This ratio has moved below -100 only four times going back to 2007, all of which developed sideways markets. We have colored with yellow circles the times when this ratio reached minus 100. Therefore we are expecting a sideways market over the 30 day or longer. Once the TICK/TRIN ratio turned up from below -100 it tended to rally above +500. When the TICK/TRIN ratio turned down from +500 the SPY at least tested the previous low if not broke to new lows. It appears the market has entered into a trading range that may last a while.
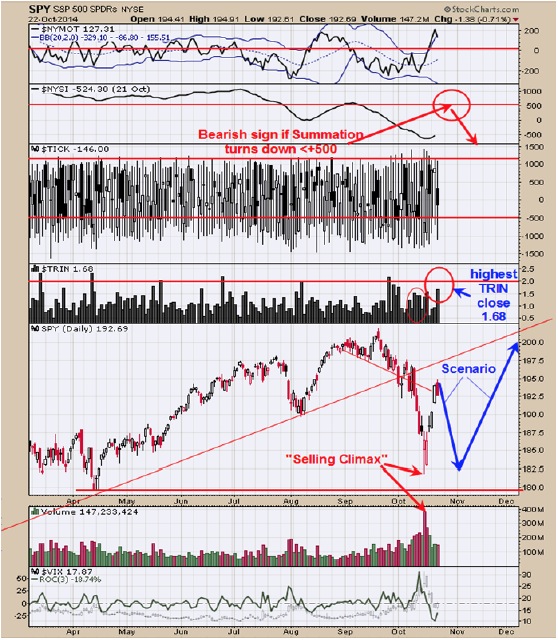
A “Selling Climax” appeared on 10/15 and most “Selling Climax” lows are tested and if tested on lighter volume would be a bullish sign and something we are watching for. Most worthwhile lows in the market form when the TRIN reach panic levels above 2.00 the highest reading at the lows came in at 1.57 and not the desired level worthy for lasting market bottom. The FOMC meeting is October 29 and 30 (Next Wednesday and Thursday) and the mid term election is Tuesday November 4 less than a week after the FOMC meeting. The FOMC and mid term election timeframes could put panic in the market and could line up a bullish signal for the market. We notice on today’s pull back the TRIN closed at 1.68 and the highest reading since before the 10/15 low. If the TRIN keeps moving higher as market pulls back into FOMC meeting and mid term elections, we most likely will get our bullish signal.
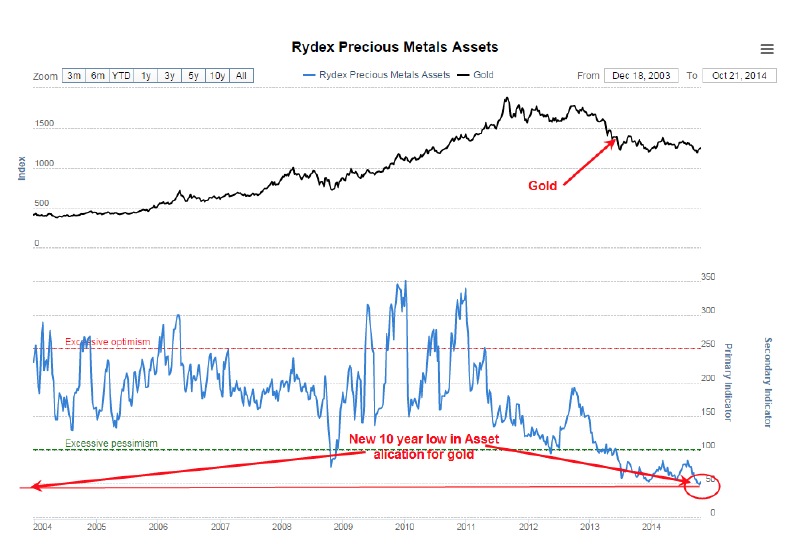
The COT Commercials positions on Gold have reached levels last seen at the June low and suggest gold is near a low. The COT Commercials position for the US dollar have reached a new short position record, reaching back to 2009 and suggests the US dollar is near a high. Markets are taking their time but the US Dollar should start to move lower as Gold starts to move higher. The chart above goes back 10 year to 1004 and shows the Rydex previous metals assets. As you can see on the chart the assets in this gold fund hit a new 10 year low and shows nearly no one is interested in gold and gold stocks and something we like to see near bottoms. It is said “The road less travelled leads to success” (or something like that). We are long GDX at 21.47 on 10/14/15.
Tim Ord,
Editor