
OPEC announced yesterday, that its members had agreed to keep the current production ceiling and hence refrain from cutting output to sustain prices. Amid the current Oil Price sell-off, this decision may come as a surprise to some who had believed that OPEC could step-in if prices fell too far. Oil and related assets sold off sharply on the news with Oil reaching 4 year lows. OPEC’s inaction does cast doubt over its influence in sustaining oil prices in the future and opens the door to possible sustainable lower oil price levels for an extended period. The decision comes at an interesting time, given that today is Black Friday’s shopping spree and that there is much talk at the moment about the actual impact of dropping oil prices on the economy.
In this post today,
• we will first review trends for Oil prices and related Energy sectors and segments
• we will then explore a few leads as to which international equity markets or industrial sectors may benefit or suffer from the drop in Oil prices
Oil prices: Brent on this Investor’s View (a Weekly, Daily, Hourly chart combination):
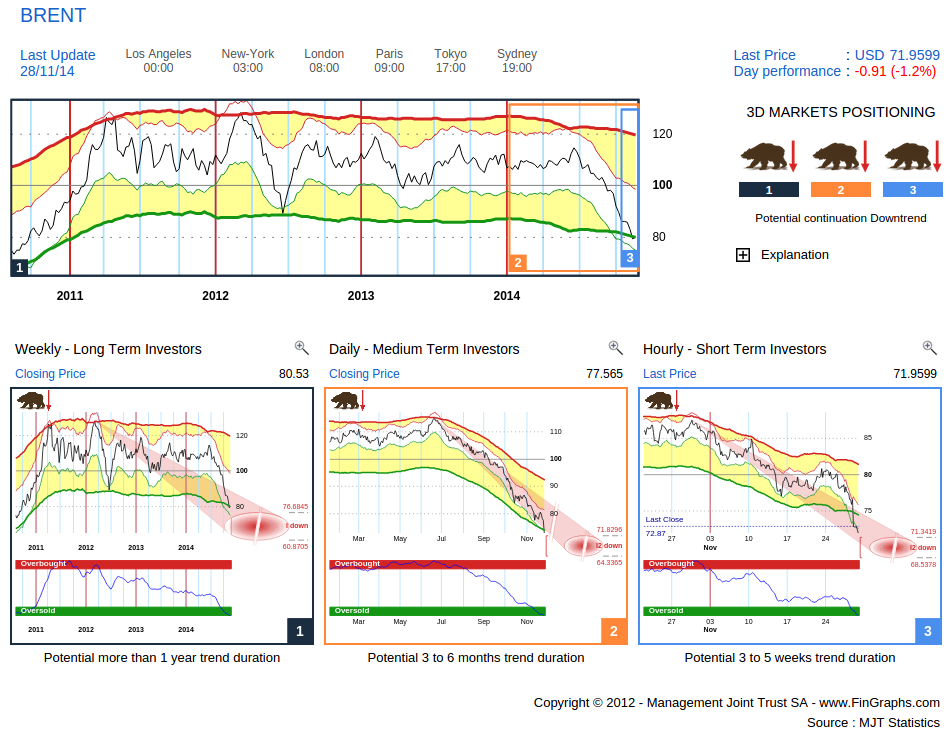
All three frequencies are heading lower in a “Potential continuation downtrend” configuration. The Weekly and Daily charts (left and middle hand chart) are showing target potential in the 60s which could materialise respectively over the few quarters / the next few months. That said, all three frequencies are quite extended for now with all Risk Indexes in the OverSold zone and our envelopes touching each other on all three charts, i.e. an intermediate bounce could be expected, but overall the trend remains down.
Energy stocks: we have chosen the Vanguard Energy ETF (VDE) to represent the Energy stocks universe as it contains a large selection of stocks and may hence be an adequate benchmark to compare against the different Energy sector segments.
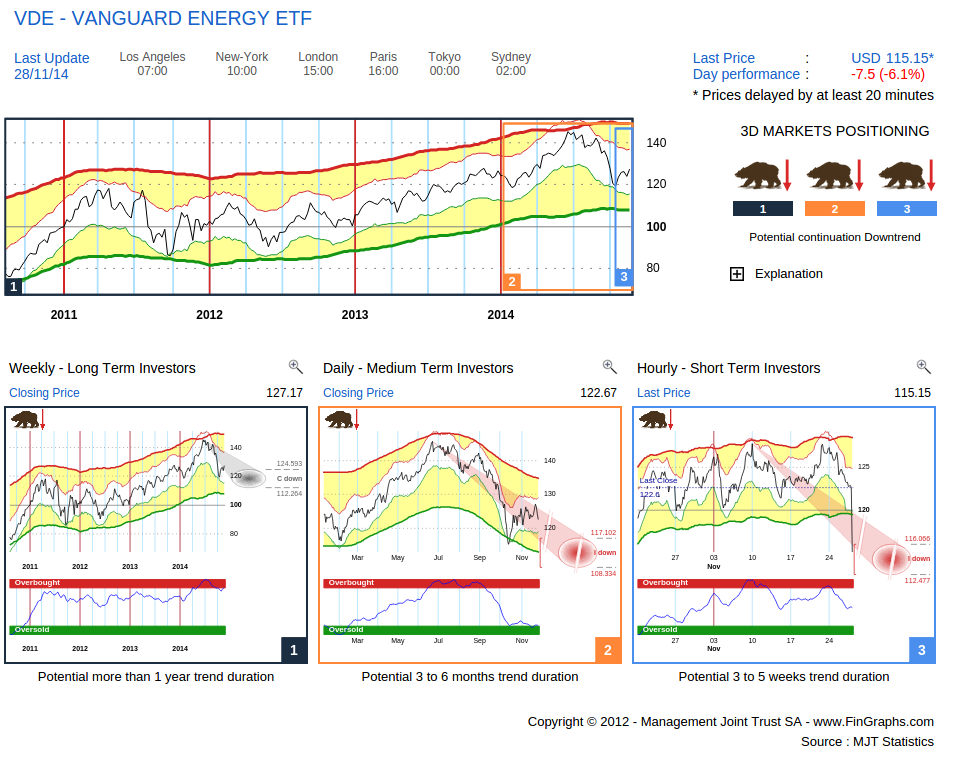
VDE is following Oil prices down on this Investor’s View. All three trends are also pointing lower. The Weekly downtrend (left hand chart) is still corrective for now. To turn impulsive, it would have to move below the lower end of its corrective targets (circa $112). This level could provide some support over the next few weeks. The Daily (middle chart) is already in an Impulsive move down. A low Risk Index in the OverSold zone may justify a bounce, but over the next few months there should be more downside potential. On the news, the Hourly, broke through its corrective targets down and is now on the way to fulfil impulsive targets (also towards $112). The Energy sector is holding up better than Oil, first due to the diversity of its constituents, then because its strong cash flows and above average dividends are discounted over longer periods (not the case for Spot Oil).
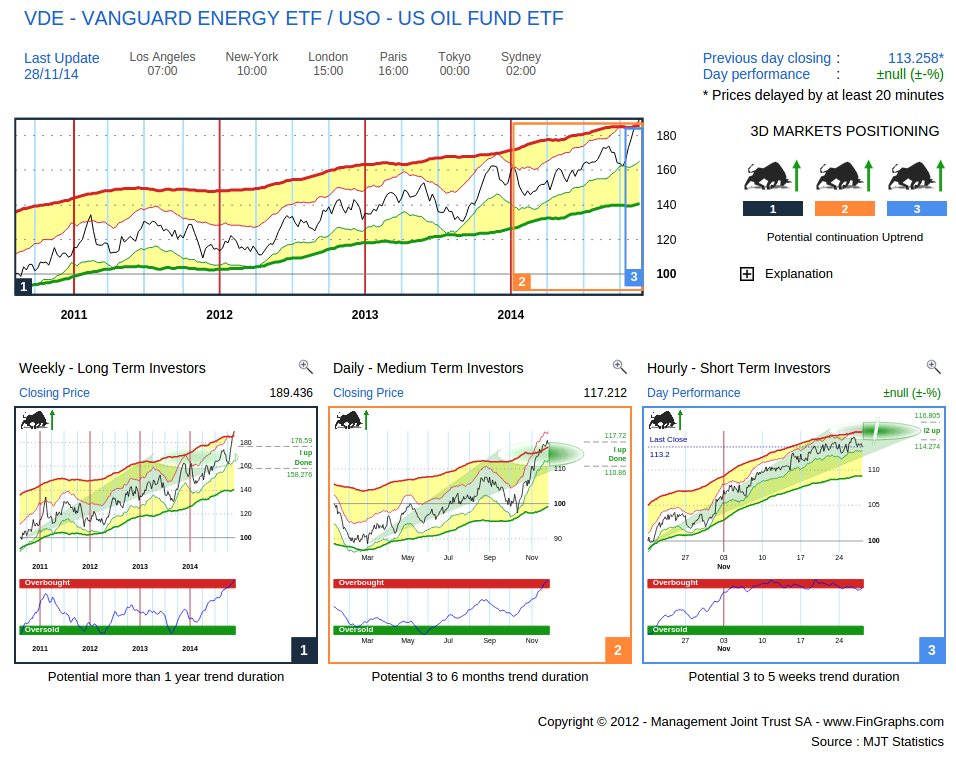
The following chart confirms this trend: VDE vs the US Oil Fund ETF (USO) with all three trends in a potential Bull (although also a bit overextended).
The picture against the general market is however different. As expected Energy has been a strong underperformer over the last few years and months. We compare VDE to the SPY SPDR 500 ETF in the following Investor’s View:
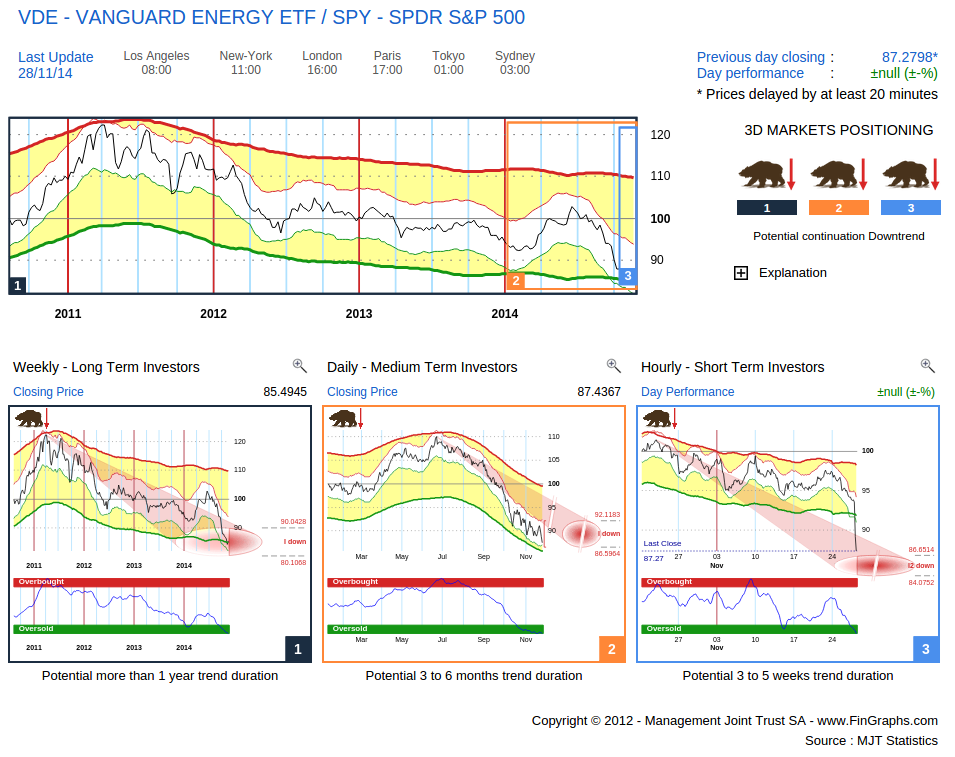
That said, when considering the Weekly chart, we are already OverSold and within the price target area (red oval). Although still negative vs the market, Energy stocks may experience a correction over the coming quarters (perhaps once the Daily trend down comes to an end).
For now, all three trends for Oil and Energy Stocks are still negative. Let’s consider the different Energy segments to understand which ones have been the most impacted by the downfall or have showed more resilience. The picture may also provide leads as to which segments may profit best from a short term Hourly bounce (i.e. to most OverSold, price sensitive ones):
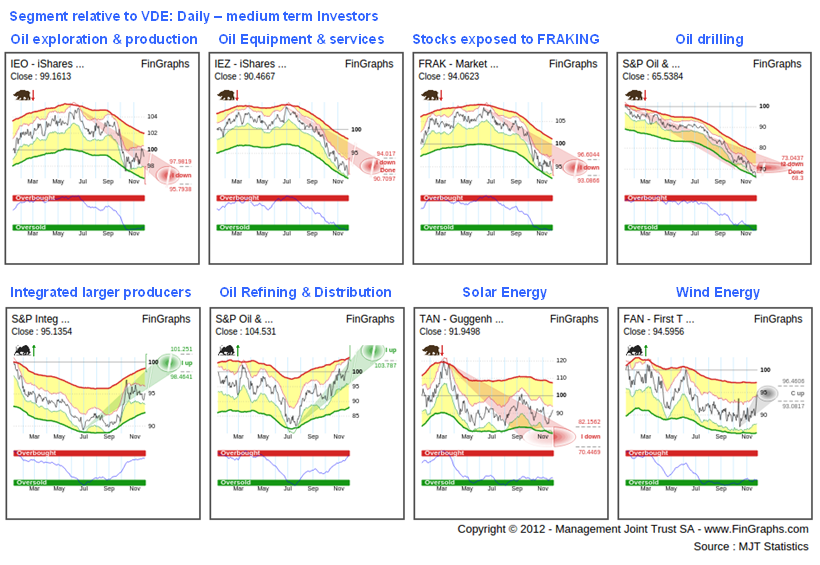
On this Daily Mosaic View (perspective over the next few months), although all these segments are in a downtrend vs the general market index (e.g. SPY), the comparison vs VDE does highlight some differentiation. Oil Equipment & Service as well as Drilling seem to have suffered the most as new Capex projects are put on halt in light on falling Oil prices. Fraking follows a similar dynamic, especially given that many of these players are leveraged and big issuers in the high yield bond market. The broader Oil Exploration & Production ETF (iShares IEO) has also underperformed but to a lesser extend. On the less negative side, one would identify large integrated players and in general downstream activities (Refining & Distribution) where margins are easier to defend. Alternative energy, although often represented by smaller companies, has performed on par and seems to be in the process of reversing up (flattish envelopes, many contact points between both envelopes, a rising Risk Index out of the OverSold area).
Except for Solar and Wind Energy, all these relative trends still seem to have a few months to run (although shorter term we may be close to some exaggeration).
We now look at countries which may be benefiting or suffering for the slide in Oil. As a proxy, we will use equity markets indexes and will focus on the ones which are significantly exposed (net exporters and net importers where oil represents a dominant portion of exports/imports):
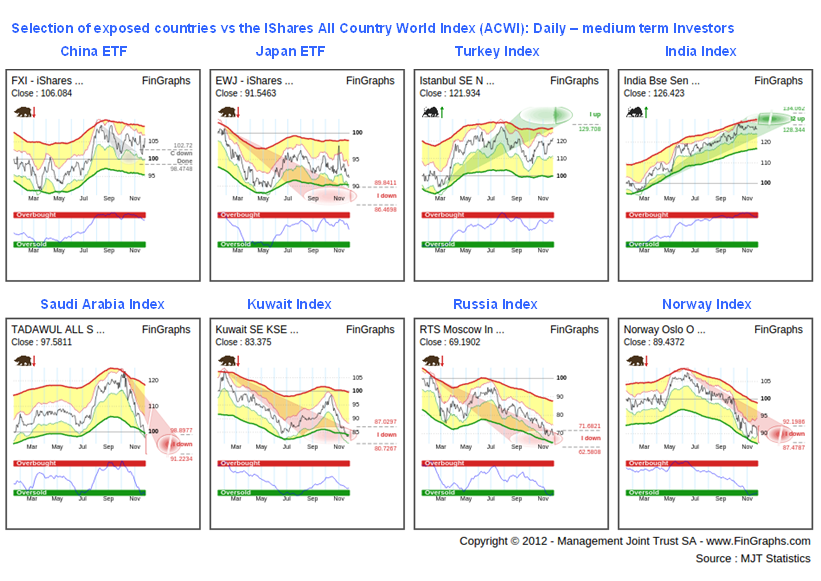
Although many other factors might be at play here, especially on the net importers front, one can notice than China has outperformed on a relative basis since July and may be close to breaking out of its current consolidation. Japan, despite the BOJ efforts and lower oil prices is still struggling with recession. Large Emerging Net Importers seem to be the clearer beneficiaries (India especially). On the net exporters front, the picture is more consistent with underperformance across the board and for now no clear sign of reversal yet.
Finally, let’s turn to the industrial sectors which may be positively impacted by the drop in oil prices. These include Retail as drop in gasoline prices are reallocated to consumption, Transport which directly benefits from lower Energy costs and well as Energy intensive Industrial production activities (e.g. Paper and Aluminium). Again, there are other factors that may be at play here. We have included the relative charts both on a Weekly and a Daily basis:
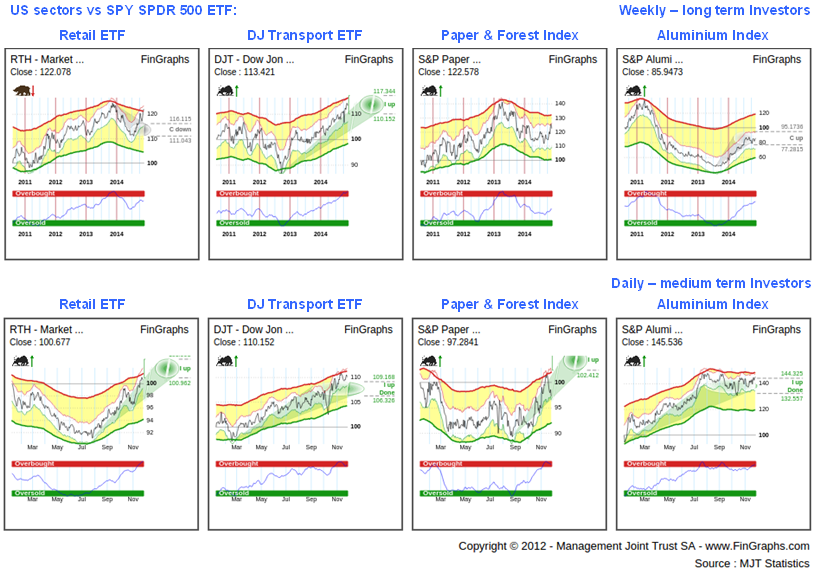
Retail has recovered from a consolidation period (Weekly chart vs SPY) and since July has been accelerating up as oil has fallen. Transport (vs SPY) was already in an uptrend on the Weekly chart, the drop in Oil prices has further confirmed this trend. Paper (vs SPY) has also bucked a Weekly negative trend and is now accelerating. Aluminium producers (vs SPY) have confirmed their Uptrend accelerating through July and are now close to breaking out again from the subsequent consolidation period. All these relative charts still show potential either on a Weekly or a Daily basis.
For more information on our methodology click here (http://www.fingraphs.com/#couponid-STKCHARTS14) and then visit ‘About Us/Press release’ and ‘User Guide’ sections of our website. Clicking that link also qualifies you for a 7 day demo and a 10% discount on our services if you choose to subscribe.
Have a great weekend, J-F Owczarczak (@fingraphs)