
This Friday’s Non-Farm Payroll numbers are sending slight jitters through the markets. It’s probably the right time to consider one’s options in respect to the US Dollar:
1. Has the current short term rally since mid October reached its exhaustion point?
2. Does the longer term upside breakout since this Spring still have potential?
i.e., are you a Trader or an Investor? And in both cases, what should you be looking at?
FinGraphs differentiates between several combinations of frequencies. Each one is tailored to represent the investment/trading horizon of the various types of market participants (Investors, Traders or Scalpers).
1. Current short term rally: exhausted?
On this Trader’s View (60min-15min-4min charts), the Dollar has entered a “Potential consolidation period in an Uptrend” (a longer term “Bull”, and medium and short term “Bears”). A Trader’s View is a combination of a 60 minutes chart (perspective over the next Week), a 15 minutes chart (perspective over the next Days) and a 4 minutes chart (perspective over the next Hours).
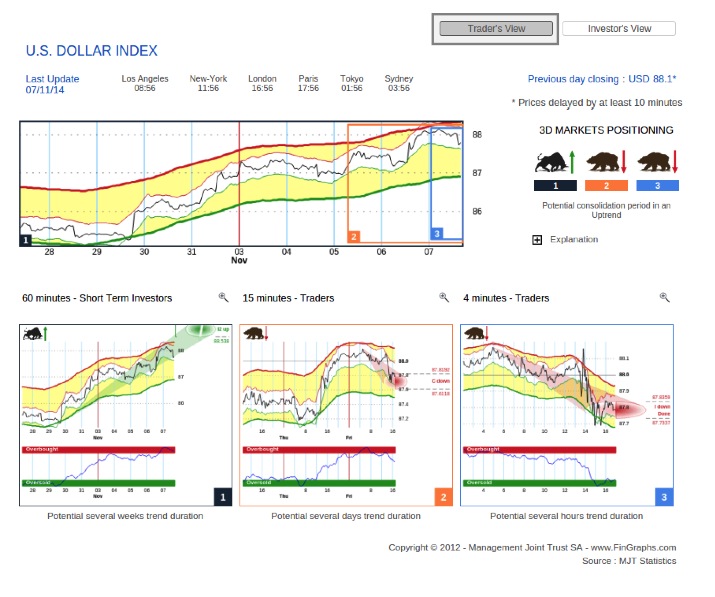
Although the 60 minutes is still heading up, the 15 minutes has started to correct. From a FinGraphs’ perspective this move down on the 15 minutes chart is only a correction for now (labelled “C down”). It has already reached its corrective target zone (from circa 87.80 down to 87.60). If it were to move below it (below circa 87.60), the price move would then turn Impulsive down, a move that could last several days with further downside potential. Targets calculation will then be updated. This is what has happened for example on our 4 minutes chart (labelled “I down done”).
2. Longer term upside breakout: should continue
The following Investor’s View (Weekly, Daily, Hourly charts) shows 3 “Bulls” or a “Potential continuation Uptrend”:
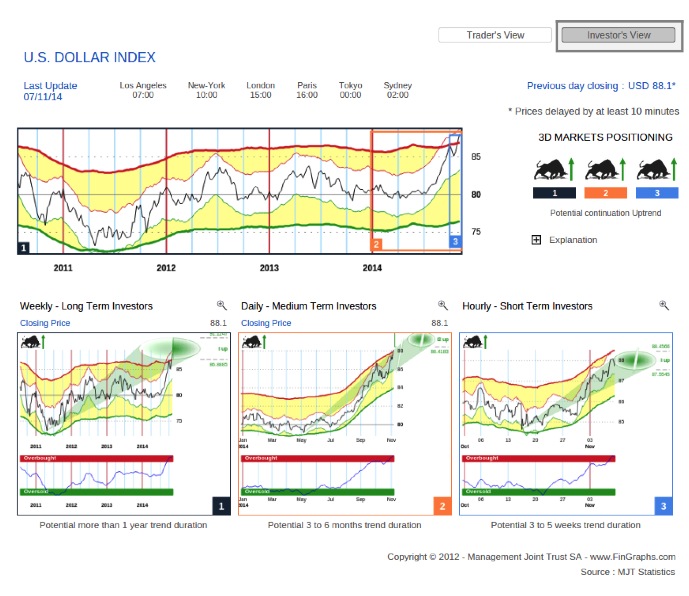
Although the Hourly is approaching its upside targets, the Daily and Weekly still show some potential up (next few months / next few quarters), possibly above 90 over the next few months.
Now, if both these time frame combinations are too long for you, FinGraphs also offer a Scalper’s View (4min, 60sec, 15sec) and a Super Scalper’s View (60sec, 15sec, 5sec). These are available over more than 200 instruments in real-time live streaming mode and sourced from several brokers (includes FX, Precious Metals, Index / Rates / Commodity CFDs).
For more information on our methodology click here (http://www.fingraphs.com/#couponid-STKCHARTS14) and then visit ‘About Us/Press release’ and ‘User Guide’ sections of our website. Clicking that link also qualifies you for a 7 day demo and a 10% discount on our services if you choose to subscribe.
Have a great weekend, J-F Owczarczak (@fingraphs)