
Comparative Analysis Indicators
Comparative and relational indicators are a vital part of every technical trader indicator tool kit. These indicators provide an unusual perspective on how Price and/or Volume are behaving, by comparing the most current data to X period ago. Comparative indicators are not generally used for long term investment analysis.
Although there are few comparative indicators they divide into two distinct groups, one group for price and the other for quantity of shares traded over time. By incorporating both in technical analysis of a stock, index, or other stock derivative, technical traders are able to see things that are not exposed by moving averages and other common overly popular indicators.
Price Rate of Change ROC is a comparative Price and Time indicator that can provide a different analysis for Momentum, Swing, and Position trading.
How Comparative Indicators differ from Moving Average Crossover Indicators
The preponderance of technical traders rely upon indicators based strictly on moving averages, where two different time periods are set with two separate moving averages laid over one another. This provides a shorter moving average over a longer moving average to create a “signal” that many traders use for entries and exits. What a comparative indicator reveals is how the stock Price or Volume is behaving in relation to how price was behaving N periods ago.
The chart example of Starbucks Corp. (NASDAQ:SBUX) has Price ROC applied to the same indicator chart window as the Accum/Dist indicator. These are both Primary Indicators and are plotted separately, rather than the normal use of a subordinate indicator which is plotted against the primary indicator. What this means is each indicator is functioning independently of the other, rather than like a moving average applied to a primary indicator which would then be reacting to the primary and reflecting that relationship.
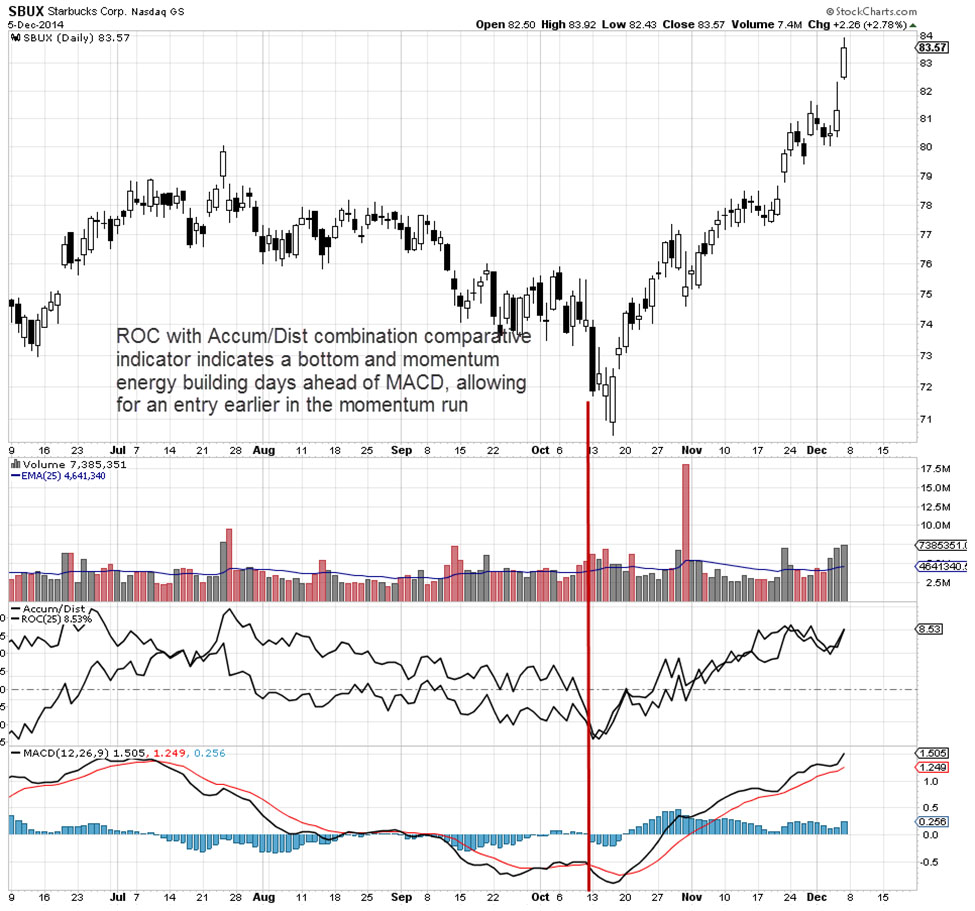
As two primary indicators this provides a powerful, yet simple tool that exposes velocity and momentum activity prior to Price moving with momentum. In today’s automated marketplace over 80% of all orders are triggered by a computer with preset trade parameters. Therefore Momentum, Swing, and Position traders need to have powerful indicators that show momentum energy is building up within the Price action, prior to the momentum run occurring.
The candlestick chart clearly shows the leading qualities of combining ROC and Accum/Dist together as a combination primary comparative indicator for momentum, swing, and position trades. This combination comparative indicator provides earlier entries for fast moving momentum bottoms and tops, which are key areas where most technical traders struggle to enter soon enough to capture the best gains of the velocity or momentum Price action.
The indicator in the bottom chart window is MACD which is the indicator High Frequency Traders HFTs are using to front run technical traders, and are doing so with ever increasing success. The chart windows show that the ROC and Accum/Dist indicator combination comparative analysis, allows for a much earlier entry out of the momentum bottom.
Summary:
Technical Traders need to use every possible advantage to compete in the automated marketplace where Dark Pools, HFTs, and Professional traders are highly active. By incorporating additional leading indicators that have comparative qualities, bottoms and tops are exposed well ahead of momentum and velocity Price action. This allows traders more time to plan their trading rather than taking the knee-jerk approach which is actually chasing the HFTs, Professional traders, and Dark Pools.
Trade Wisely,
Martha Stokes CMT
www.TechniTrader.com
info@technitrader.com