
Monitoring purposes SPX; Closed short SPX on 12/10/14 at 2026.14= gain 2.37%. Short SPX 12/5/14 at 2075.37.
Monitoring purposes Gold: Gold ETF GLD long at 173.59 on 9/21/11.
Long Term Trend monitor purposes: Flat
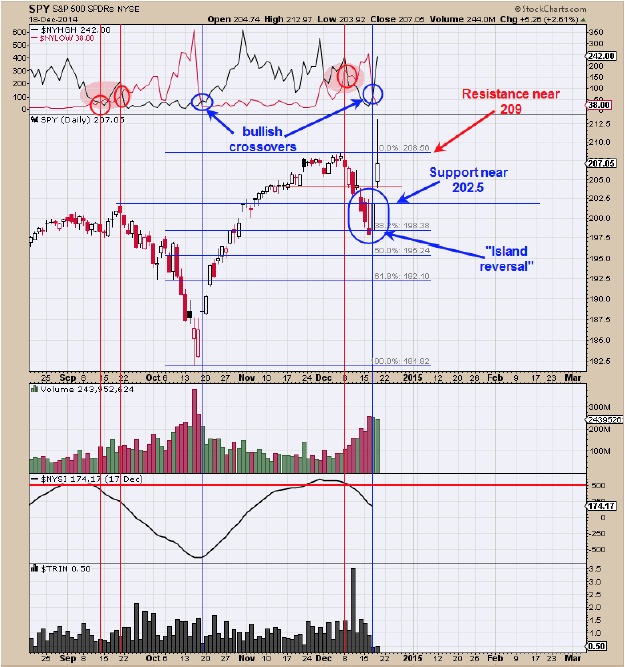
The top window is the NYSE new highs and NYSE new lows. Today a bullish crossover has been triggered and adds to our other indicators on page two that have turned positive. It appears a bullish “Island reversal” was triggered today on today’s gap up and suggests a longer term bullish scenario. Also today’s gap could be a “Mid point gap” (a gap that forms at the middle of a run) and give a target to the previous highs near 209 on the SPY. Today’s tall line above the close, we believe, was a misprint. There have been gaps after FOMC meetings days in the past and all have been tested within a week. Therefore a lighter volume test of today’s gap could lead to a buy signal, which comes in near 203-204 range on the SPY. Neutral for now.
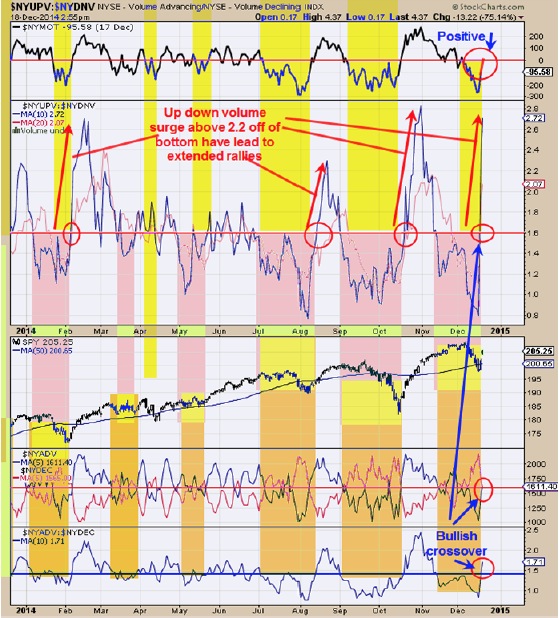
The chart above helps to find reversals in the market. The bottom window is the advance/decline line with 10 period moving average. A close above 1.40 is a bullish sign and today’s reading came in at 1.71. Next window up is the Advancing issues with 5 period moving average and Declining issues with 5 period moving average. A crossing of these two moving averages is a bullish sign and today they crossed. Second window down from the top is the NYSE up volume/NYSE down volume with 10 period moving average. A close above 1.60 is a bullish sign and today close came at 2.72. A surge of this indicator off of a low that surpasses 2.2 suggests the rally will be extended and therefore the current rally can be lasting. The top window is the McClellan Oscillator and a close above “0” is a bullish sign and today’s close came in at 13.55.
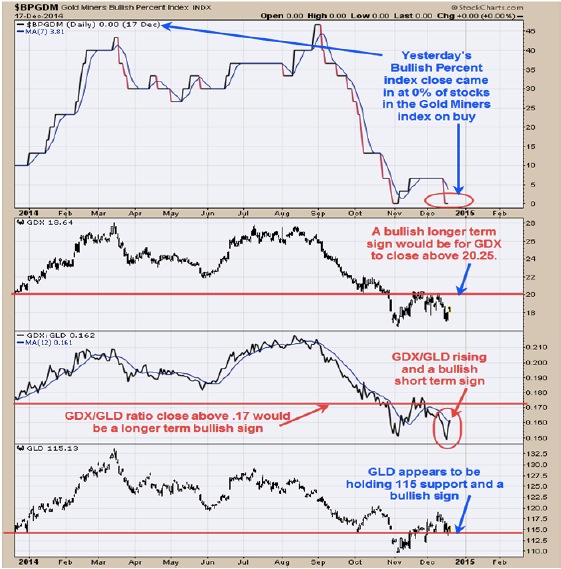
Last Thursday’s report we showed the monthly HUI/WTIC (Gold Bug/Light Crude oil) ratio dating back to 1996. All the major lows in Gold stocks going back to 1996 have occurred when the RSI of this ratio turned up from below 30 and closed above 30; Slow stochastics turned up from below 20 and closed above 20 and True Strength index (TSI) turned up below 20 and closed above 20 and this ratio has met those requirements. Therefore the longer term picture looks promising for gold stocks. The above chart is the short term perspective for gold and gold stocks which is not showing a bullish picture, at least not yet. The top window is the Bullish Percent index for the Gold Miners index and as you can see there are no point and figure buy signals in this index. GDX is still below support near 20 and so bar not showing any strength. A close above 20 on GDX would produce a bullish “Shakeout” and give a target to 28 range. The GDX/GLD ratio is showing short term strength as it has been rising over the last couple of days. However is not showing any longer term positive divergence at this point. A close above .17 would be a longer term bullish sign both for gold and gold stocks. GLD does appear to be finding support at the important level near 115 and is a positive sign. In conclusion the long term picture looking promising but the short term picture is still negative.
Tim Ord,
Editor
Send email to Tim@ord-oracle.com for free 30 day trial to The Ord Oracle report.