
Monitoring purposes SPX; Sold 9/30/14 at 1972.29= gain .003%; Long SPX on 9/25/14 at 1965.99.
Monitoring purposes Gold: Gold ETF GLD long at 173.59 on 9/21/11.
Long Term Trend monitor purposes: Flat
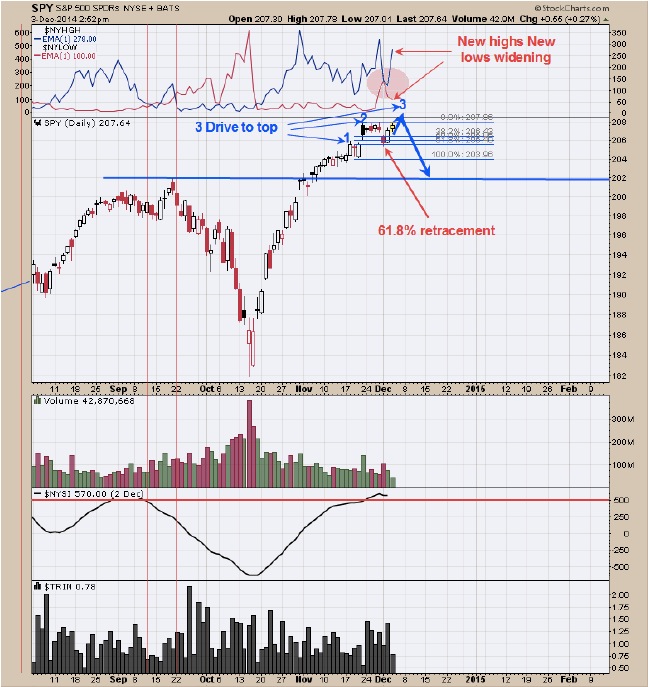
The following is near what we said yesterday and see little need to make changes. “The top window is the NYSE New highs (blue line) and NYSE New lows (red line). Two bearish crossovers occurred at the September high and December 1 market action nearly produced a bearish crossover but fell short.
Today’s rally widened the spread and remains on a bullish course. The pattern that may be forming here is a “Three Drives to Top”. The pattern sets up on the retracement off the second top which is at least a 61.8% retracement of the previous rally and the SPY did just that on the recent low. If the market continues higher and break to a new high will produce the third and final top. Still expecting a top near current levels but may see a new high before a top is in.” There is a cycle low due in mid December and the FOMC meeting is December 16 and 17 and could set the stage for the Santa Claus rally. To help pick out the next low a TRIN close above 2.00 would be ideal.

The above chart show the percent of stocks in the NYSE that are above their 150 day moving average. Normally when the percent of stocks their 150 day moving average is above 60% than the market is considered healthy. Even though the NYSE is near the high the percent of stocks above their 150 day moving average stands at 53.76%. There is also resistance here where the NYA broke below the trend line up from the 2011 low back in October and is now running into that resistance line again. Also the McClellan Summation index appears to be turning down near the +500 where steep declines can occur. However, we are not looking for a large decline here but a pull back to 10500 range is possible. The pattern that may be forming here on the NYA is a Head and Shoulders bottom where a pull back near 10500 range would form the Right Shoulder then from there up. Our short term models are still bullish but in a weakening position. Still looking for a pull back in the current range and are still on a neutral stance.
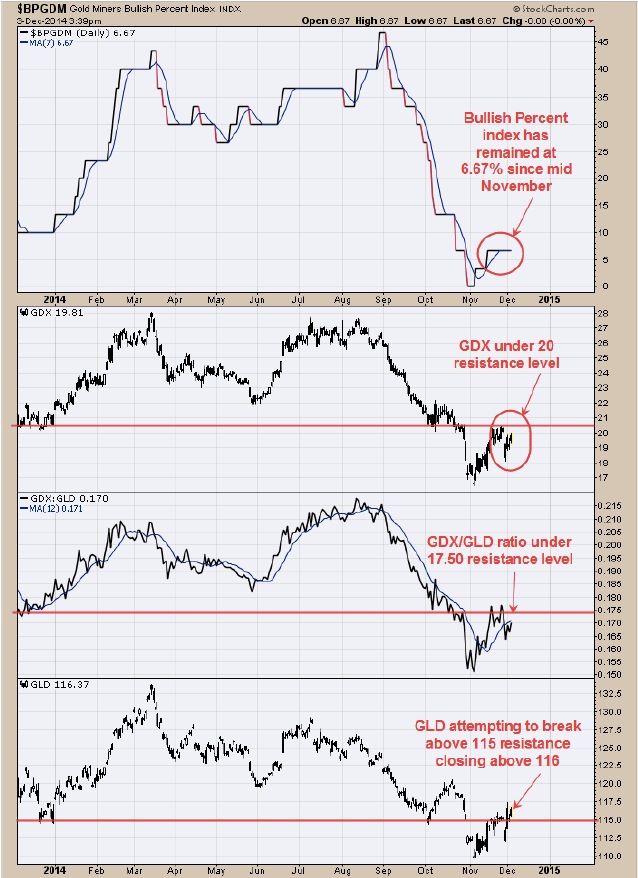
The top window is the Bullish percent index for the Gold Miners index. The Bullish Percent index still stands at 6.67% of the stock in the Gold Miners index that is on point and figure buy signals and unchanged since mid November and not a healthy percentage for the market to continue its rally. Ideally, one would like to see the Bullish Percent index increasing as that would show the internals of the market are getting stronger. Next window down is GDX. Last week GDX ran into resistance near 20 and has backed off. A break through 20 with a “Sign of Strength” would be a bullish sign for this market. Nest window down is the GDX/GLD ratio. This ratio also ran into resistance near 17.50 and has backed off and keeps this ratio in a bearish mode. A break above 17.50 would be a bullish sign Next window down is GLD. GLD did break through the 115 resistance level with decent volume on Monday and back off yesterday to close at resistance. Today GLD attempted to rally on much reduced volume and shows weakness. For a bullish picture to form for gold issues one would like to see GDX to outperform GLD and not the other way around which is what is occurring here. Gold indexes are at decision points and either market pushes through these resistance areas and turns the picture bullish or backs off and keeps the picture neutral. It appears this market needs more time to make up its mind.
Tim Ord
Editor
www.ord-oracle.com
For free 30 day trial just drop us your email address to tim@ord-oracle.com