Naturally as a Swiss citizen, I need come back on the historical move by our Swiss National Bank yesterday. The decision to drop the 3.5 year old 1.20 floor took the market by surprise and is fuelling widespread criticism in Switzerland and around the world. It created havoc in the Forex Exchange markets with the EUR/CHF and USD/CHF respectively touching 0.85 and 0.74 on the news (a 29% and a 28% drop) before stabilizing slightly below parity for EUR/CHF and at circa 0.86 for USD/CHF at the end of the day. The Swiss main index (SMI) dropped nearly 9% during the session and another 5% today.
Among immediate losers, one could count any margined position holders which were short CHF or long the SMI (and in some cases, their brokers) as well as any Swiss based private, corporate, institutional or financial holders of foreign denominated assets and domestic Swiss stocks. More generally, all Swiss citizens have virtually taken a hit: the national bank is now theoretically insolvent due to CHF 60 billion in unrealized losses on its foreign exchange positions (almost 10% of the country’s annual GDP). Over the medium to longer term, consequences are dire for Swiss exporters (watches, machinery, chemicals, pharma) which are put at an immediate competitive disadvantage. Tourism and Swiss based global banks, which rely on significant foreign income streams, will also suffer.
Many would argue that the sudden announcement without any forward guidance is highly irresponsible as it inflicts large losses around the world. Now, did the SNB really have any choice? Could it have, for example, engineered a staged lowering of its floor (1.15, then 1.10, 1.05…)? We believe that the weakness it would have signalled would have put every lower floor onto immediate pressure, forcing the SNB to expensively defend them before letting go. How many additional EUR purchases by the SNB would it have triggered? Would it have allowed professional investors time to hedge down along the way? Nevertheless, many private and less sophisticated investors would have probably been left with their exposure.
True, the timing was very difficult to judge, and, no later than Monday, SNB’s Vice President did reiterate commitment to the floor on Swiss national TV. But at some point either the Eurozone needed to start recovering or the floor had to go. The SNB had accumulated the equivalent of 80% of Swiss GDP in foreign exchange exposure (just imagine if the FED did the same). In our article a couple months ago on “Save our Swiss Gold”, we mentioned that “this intervention cannot go on forever”; obviously, as the vast majority of observers, we didn’t expect it to go so quickly.
History will tell us if the 3.5 year life-line it guaranteed the Swiss economy was worth the large capital losses just incurred by Swiss citizens, their national bank and their pension funds. It may conclude that the floor was deemed to fail from the start. What we will never know, is how much more damage the floor strategy could have inflicted in the future if it had be let to continue. The prospect of Quantitative Easing in Europe and the mounting pressure related to it were probably the triggers. The problem had however been brewing for some time.
Let’s now turn to the direct aftermath of the shock and try to assess the situation going forward. We first present the Traders View (a combination of a 60min, 15min and 4min) on EUR/CHF and USD/CHF. Although these were taken earlier today and are probably already outdated, they present a better view than the Investor’s View (Weekly, Daily, Hourly) which basically show a straight line down.
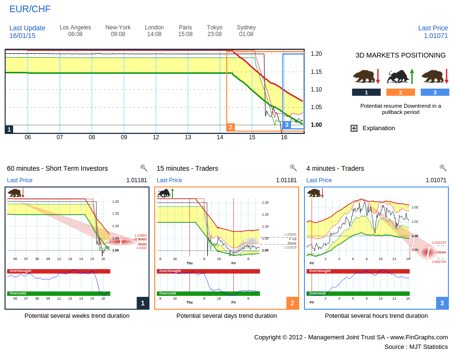
When the floor was introduced in 2011, EUR/CHF was already flirting with quasi parity. Three years down the line with the Swiss economy in better shape and the resurgence of problems in the Eurozone, it is hard to assess if the parity will provide sufficient support (although the SNB also announced negative 0.75% interest rates on all on sight deposits starting January 22nd). Our Inter-day, Intra-week 60min (left hand chart) does seem well Oversold, having reached beyond its Impulsive 2 extended targets (“I2 down done”), but these are exceptional circumstances and the 0.85 that were briefly quoted on the news do provide frightening prospects. The 15min (middle chart) had been correcting up this afternoon. It is/was only a correction for now. Reinstating an impulsive uptrend to initiate a proper counter-trend move would require it to make it back above 1.056, a prospect that for now seems highly unlikely. Our 4min (right hand chart) was already rolling over again. As I write, it is back down close to the red oval we projected this afternoon (i.e. slightly below parity).
Trader’s View – USD/CHF:
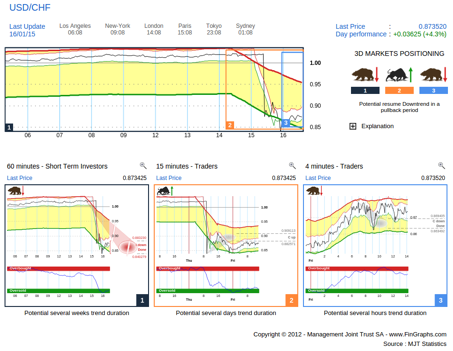
On USD/CHF, the situation is similar although less extended thanks to a further decline in EUR/USD. The 60min (left hand chart) is within Impulsive targets (“I down done”) and similarly to EUR/CHF the 15min (middle chart) had been correcting up this afternoon. In order, to reinstate an impulsive trend up, it would have had to make it above its “grey” corrective target zone just below 0.91, a level it got close to yesterday in the rebound following the crash. As we speak, it reinitiated the downtrend on the 4min (right hand chart). It is now below the grey corrective targets just under 0.86.
Historically, these 0.86 - 0.87 levels are important, We will consider them as with the following Weekly chart of USD/CHF:
Weekly chart – USD/CHF:
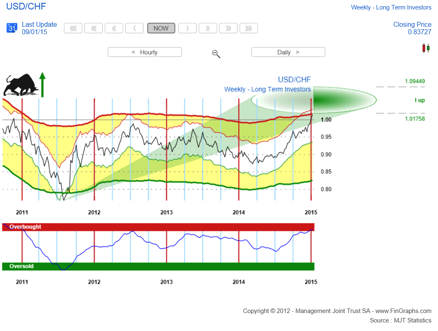
Indeed, these levels did provide some support during the 2 Quarter 2011 sell-off as well as during the rally that followed in the 3rd and 4th Quarter of that year. Again the correction down into early 2014 did settle around these levels before resuming the uptrend. Let’s hope these historical levels will provide some stickiness in days to come.
Both EUR/CHF and USD/CHF lead us into EUR/USD. Last week in our contribution titled “The Grexit Euro Bluff” we tentatively argued that much of the bad news was probably out. Our Daily charts were within their Impulsive 2 extended targets down and the Hourly charts had achieved Impulsive targets down. The situation seemed quite Oversold and could justify an intermediate bottom. Well, we didn’t expect this further piece of adverse news, not now at least. It implies that the EUR has probably lost its strongest strategic buyer. We had however pointed out, that the move could extend to the lower boundaries of its Daily Impulsive 2 targets or towards 1.15. This price for now has provided support in this post floor sell-off.
Investor’s View – EUR/USD
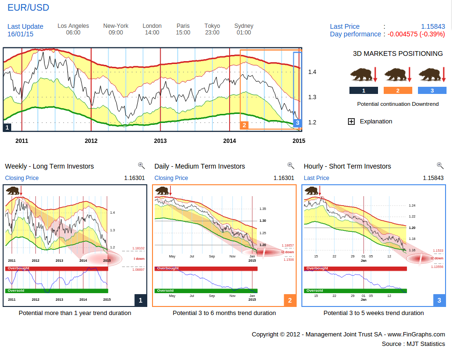
As mentioned above, the Daily (middle chart) has now fulfilled its Impulsive 2 targets, a measurement usually reserved for very extended moves. This would imply that over the next couple of months the potential down is possibly exhausted. Longer term, however, on our Weekly (left hand chart), there is still potential down over the next quarters, possibly towards 1.10 or slightly below. If we now focus on the Hourly (right hand chart), the price move is also approaching Impulsive 2 targets. These could lead the pair to 1.135 over the next week. If achieved, both the Daily and Hourly downtrends will be heavily exhausted. Now, it’s always a challenge trying to pick an intermediate bottoms in a strong Weekly downtrend.
The following Mosaic present the SMI and the three largest Swiss corporate stocks (from left to right: SMI, Novartis, Roche and Nestlé) on an Intraday basis (4 min charts). The top line presents their price evolution in CHF, the bottom is denominated in USD.
4min Mosaic View – SMI, Novartis, Roche, Nestlé (top line in CHF, bottom line in USD):
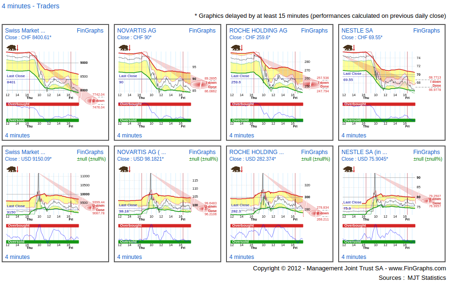
For Swiss Investors, it has been a bloodbath, with SMI constituents plunging circa 15% on average over the last 2 sessions. In USD terms however, although equity price were quick to adjust following the currency spike, they are still trading slightly above the levels seen prior to the news. The market, for now, doesn’t seem to be discounting a significant loss in competitive advantage. It is merely adjusting for the currency effect. The phenomenon would be even more pronounced if we were to consider these in EUR terms. The next few days/weeks will show if the negative prospects for the largely export based Swiss economy do effectively translate into lower equity prices for foreign investors into Switzerland.
The following 60min Market Mosaic recaps from left to right some of the known biggest losers of the shock SNB announcement:
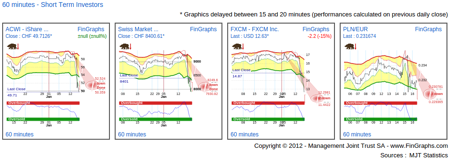
• foreign and Swiss equity investments for Swiss Investors (the All Country World Index Tracker from iShares in CHF terms and the SMI: first 2 charts)
• FXCM: the world largest retail on-line FX broker, which saw its share price crash 95% from $37/share 2 days ago to a pre-open indicative price of $1.49 this morning before it got suspended. Losing margin positions related to the SNB announcement had left its customers owing it about $225 million. As a result, the company was in violation of capital requirements. We learn, this evening that it has received a $300 million rescue package from Investment Bank Jefferies. It is always amazing to see how 15 years of hard work can evaporate in several minutes. Similarly, other players in the industry have been also been hit hard, with Alpari UK and Excel markets from New Zealand filing for bankruptcy and several other leading on-line brokers announcing large losses.
• Polish home owners, which again, as in 2011, have been caught naked with CHF denominated loans on their houses. Exposure amounts to circa CHF 30 billion and as the Zloty to Euro chart shows, PLN is even underperforming in EUR terms. Other countries such as Croatia and Hungary are also impacted in a similar way.
We can also identify several winners from the announcement as show in the following Mosaic View:
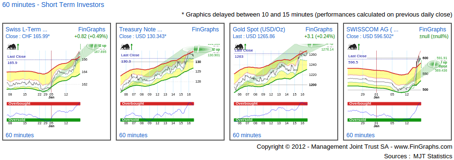
• Long dated Swiss and US Government Bonds, represented here by their respective 10Y futures (first 2 charts), mirroring flight to quality
• Gold, for similar reasons (see more detailed analysis below)
• Swiss stocks with a captive domestic client base such as for example Swisscom, Switzerland’s largest telecom operator. It is slightly positive over the last two sessions in CHF terms and posts a 20% appreciation for USD denominated investors.
Finally, we will have a closer look at Gold, which has broken out above its corrective targets on our Daily charts.
Investor’s View – GOLD:
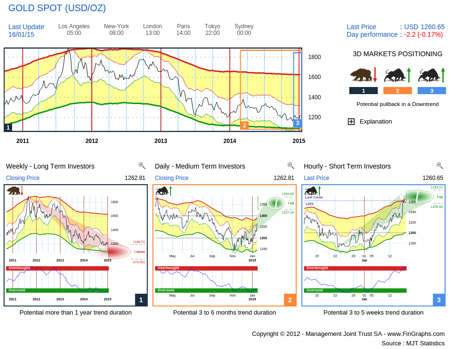
Gold is still in a downtrend with some potential down left on our Weekly (left hand chart). On our Daily (middle chart), it has broken out above its corrective targets into impulsive territory with potential up to the mid 1’300s over the next few months. For now, we would label this move as an intermediate correction up, not a reversal, given the Weekly downtrend still in place. It is driven by seasonality as well as concerns over the situation in the EuroZone. The SNB announcement has only added to the upside momentum, helping it break above Daily corrective targets as well as the 1’250 October resistance (which was also the early June support). We would look to hold this support level over the next few days as the CHF situation settles in order to confirm the break-out and the Impulsive Daily targets up.
For more information on our methodology click here (http://www.fingraphs.com/#couponid-STKCHARTS14) and then visit ‘About Us/Press release’ and ‘User Guide’ sections of our website. Clicking that link also qualifies you for a 7 day demo and a 10% discount on our services if you choose to subscribe.
Have a great weekend, J-F Owczarczak (@fingraphs)
