
Monitoring purposes SPX; Sold SPX on 3/3/15 at 2107.78= gain 2.82%; Long SPX 2/3/15 at 2050.03.
Monitoring purposes GOLD: Gold ETF GLD long at 173.59 on 9/21/11
Long Term Trend monitor purposes: Flat
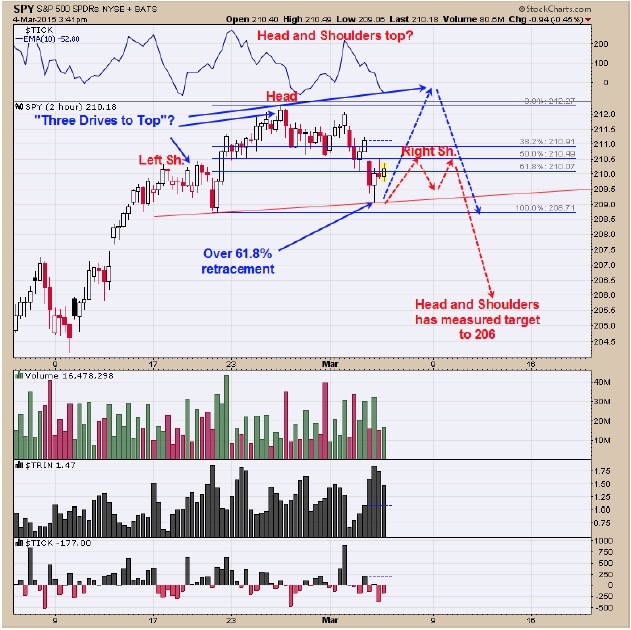
The chart above is the SPY on a two hour timeframe. The decline over the last two days which retraced over 61.8% of the leg up form the February 20 low, could be drawing two patterns which is either a “Head and Shoulders top” or a “Three Drives to Top”. A “Three Drives to Top” would require one more new minor high before retracing back down to where the pattern began, which in the current case would have a target near 208. If the pattern turns out to be a minor “Head and Shoulders top” than next bounce may find resistance near 211 range creating a “Right Shoulder”. This potential “Head and Shoulders pattern” has a downside measured target to 206 range. Next week is the week before option expiration week which if there is going to be a decline it most likely will be next week and the week to look for the next low. If market trades above last weeks high and If indicators remain bearish, we may look for a short position for a target near 208. If market just modestly bounces and does not trade above the previous high than will look for bullish signal near 206.
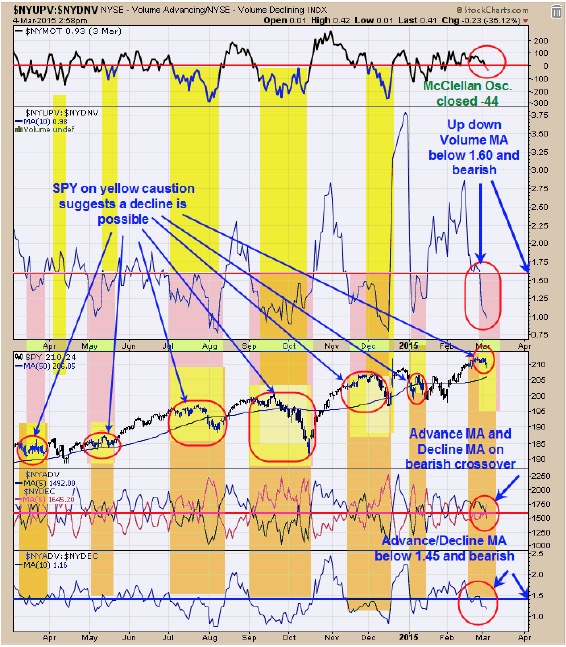
We showed this chart yesterday and is updated to today’s data. The top window is the McClellan price Oscillator. Tops normally form when the McClellan Oscillator is below “0” and today’s reading came in at -45. Next window down is the NYSE up volume/NYSE down volume with 10 Period moving average. It’s a bearish sign for the market when this ratio falls below 1.60 and today’s reading came in at .98. The bottom window is the NYSE advance/NYSE declining with 10 period moving average. It has been a bearish sign for the market when this ratio closes below 1.45 and today’s close came in at 1.16. Next window up is the NYSE advancing issues with 5 period moving average and NYSE declining issues with 5 period moving average. A bearish crossover is in effect and another bearish sign for the market. All four indicators on this page are on bearish signals. On the SPY window we have colored coded each indicator and when they overlap they produce a yellow color on the SPY chart meaning caution. As you can see the SPY is in the caution yellow area now. Sold long SPX on 3/3/15 at 2107.78 for gain of 2.82%; Long SPX at 2050.03 on February 3, 2015.
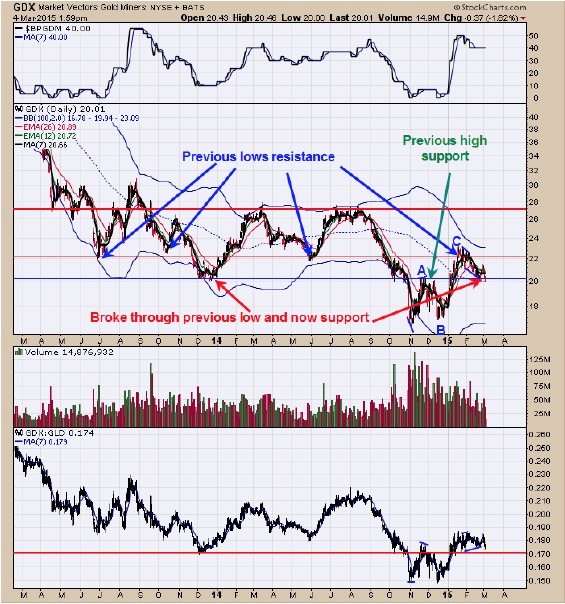
The rally from the December 2014 low broke through low of December 2013 and rallied up to the next resistance to the lows of June and October 2013 as well as June of 2014 and found resistance near the 22 range. GDX turned down from 22 and should find support near 20 range which is the December 2013 low and November 2014 high. If market does find support near 20, the best it could do is 22 as that still remains strong resistance. There will be bounces and declines for the next several months as the next cycle low is due later in the July to August time frame. The July to August time frame would expect a longer term up move to begin that will be worth catching.
For free 30 day trail just drop us a line at tim@ord-oracle.com.
All the Best,
Tim Ord