
Increasing Risk Of Short Term Topping
Rotation is a methodology used by fundamentalist Giant Buy Side Institutions to reduce their portfolio risk factors during weakening earnings seasons and during the summer. Rotation is not distribution which occurs when large mutual funds are forced to sell large quantities of their Charter stocks to meet redemption demands. These patterns of slow consistent selling often occur as new investors and new retail traders are buying into the big blue chip stocks.
Since the Dark Pool venues offer the fundamentalist Giant Buy Side Institutions a plethora of new order types which allow for maximum control over accumulation, distribution, or rotation the fund managers are able to set up an automated system of incremental, slow, and steady rotation that at first does not affect the trend. However as the smaller lot buyers begin to lose their capital resources and buying power, rotation can and does start to show up in the charts.
Below is a stock chart example of how rotation has started to weaken the COMPQX and put this index at an increasing risk of more downside action.
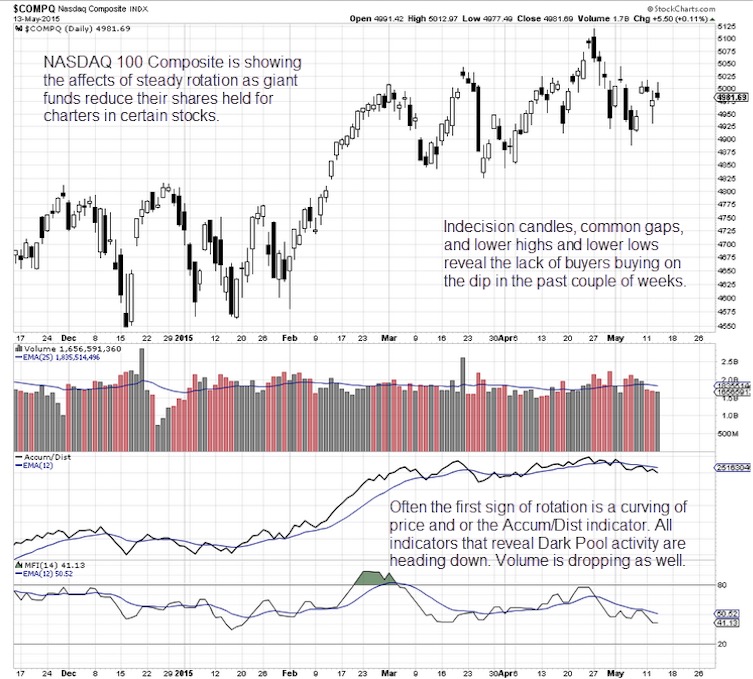
The chart of the NASDAQ Composite 100 Index is clearly showing an increasing risk of a short term topping formation. Instead of the trading range that the Dow and S&P500 are developing, the NASDAQ 100 had a higher peak that has now formed lower highs and lower lows, consistent with a rising risk of a short term correction.
In addition the candles that have formed over the past couple of weeks are smaller, with frequent common gaps that fill quickly. Indecision candles are also occurring more often. The three primary large lot versus small lot indicators are turning and heading downward, under the increasing weight of rotation selling by the giant and larger funds. Percent Shares Held by Institutions PSHI also shows for most of the 100 companies in the NASDAQ, a lower percentage of shares held by institutions.
Unless there is a surge of new investor and retail trader buying, the NASDAQ has an increasing risk factor of breaking down into a short term correction. Support levels are strong at the highs of December 2014 and January 2015, and the support from the lows of March and April 2015.
Summary
What the chart shows best is how rotation, even mild rotation can quickly overwhelm the “buy on the dip” individual investors and retail traders. For now High Frequency Traders HFTs are not triggering huge sell short one day runs down, but those individuals who are trading or investing in NASDAQ stocks should carefully study their held positions for downside technical patterns.
HFTs can and do trigger without warning, however there is usually plenty of rotation patterns and weakening technical quantity and accumulation/distribution patterns before the HFTs trigger and sells or gaps down the stock. Recognizing HFT trigger patterns is crucial for all technical traders.
Trade Wisely,
Martha Stokes CMT
www.TechniTrader.com