
Monitoring purposes SPX; Short SPX on close (4/29/15) at 2106.85.
Monitoring purposes Gold: Flat.
Long Term Trend monitor purposes: Flat
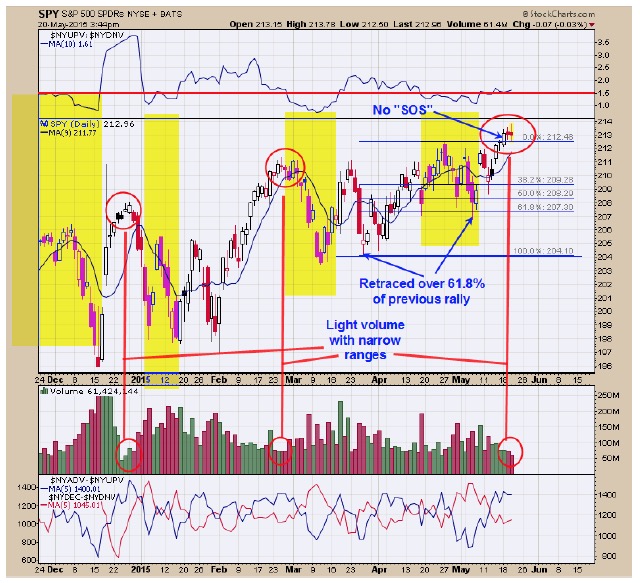
Market is having a hard time moving higher. We circled in red the previous highs of December and February to show the similarities to the current market. Its usually a bad sign for the market when volume drops off and narrow range start to occur which both conditions appeared at the December and February high as will as in the current market. The early May low near 207 on the SPY retraced over 61.8% of the previous rally up from the late March low. Healthy markets normally retrace 50% of less. The break to new highs on Monday was not accompanied with a “Sign of Strength” (SOS) and therefore, did not give confirmation of the breakout. As mentioned before, its common around holidays for reversals in the market to occur and this weekend is Memorial Day holiday.
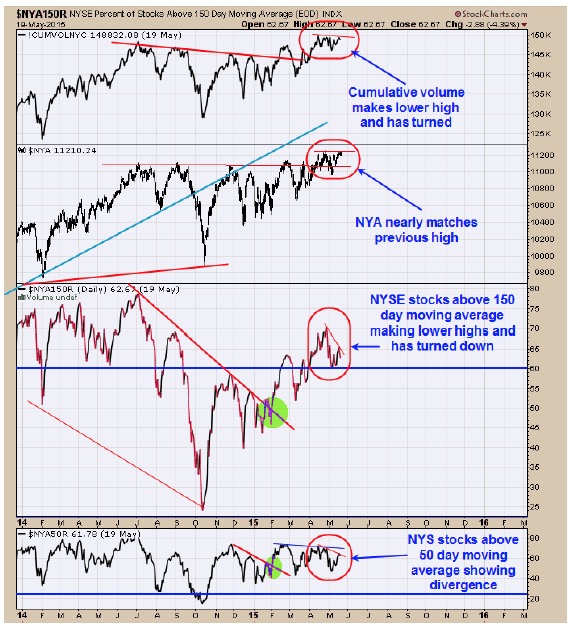
We showed these indicators yesterday which are still showing weakness and two of these indicators turned down; Cumulative volume and stocks above 150 day moving average. The top window is the NYSE Cumulative volume which is making lower highs as NYSE nearly matched its previous high and has turned down. Bottom window is the NYSE stocks above their 50 day moving average and it also making lower highs. Next window up is the NYSE stocks above their 150 day moving average and it also making lower highs and has turned down. In a healthy market these indicators should be matching if not breaking to new highs. We are short the SPX on 4/29/15 at 2106.85.
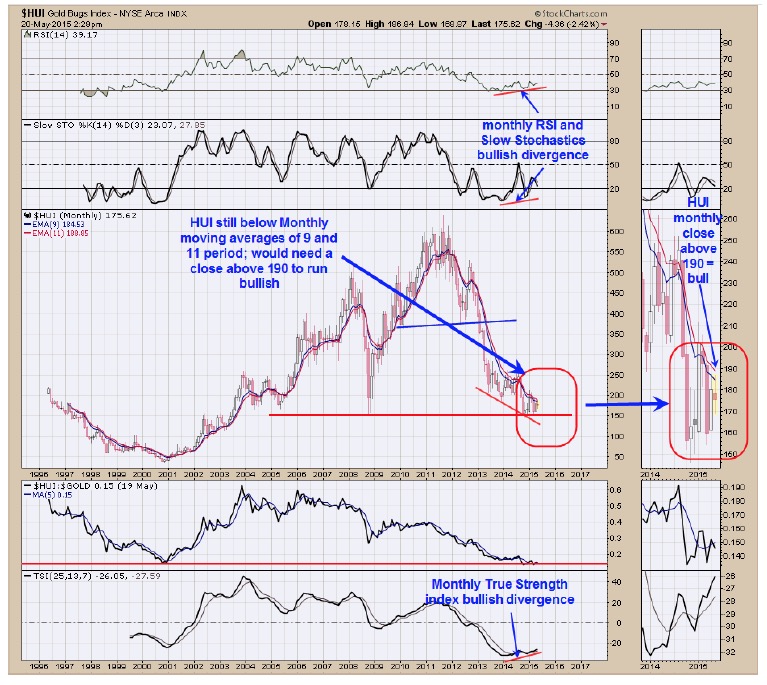
Short term GDX is flipping above and below the important level near 20.20 and not give a solid trigger. Above is the longer term view of the monthly HUI (Gold buy index). The top two windows are the monthly RSI and slow stochastics which has been showing a bullish divergence starting in early 2014. The bottom window is the monthly True Strength index which is also showing a bullish divergence since the beginning of 2014. However none of that matters until momentum turns up. On the HUI monthly chart we have the 9 and 11 period moving averages and when these moving average turn up will imply this market momentum has turned up. As you can see on the small window to the right of the chart, it would require a close above the 190 range which is about 15 points above current levels.
Again there are numerous monthly bullish divergence but momentum needs to turn up to complete the bottoming process. A major cycle low is due in July or august and possible the time when the bull begins. Staying neutral for now.
For examples in how "Ord-Volume" works, visit www.ord-oracle.com.
Tim Ord,
Editor