
Monitoring purposes SPX: Short SPX on close (4/29/15) at 2106.85.
Monitoring purposes GOLD: Flat
Long Term Trend monitor purposes: Flat
Timers Digest recorded the Ord Oracle #6 in performance for 3 months updated March 9, 2015.
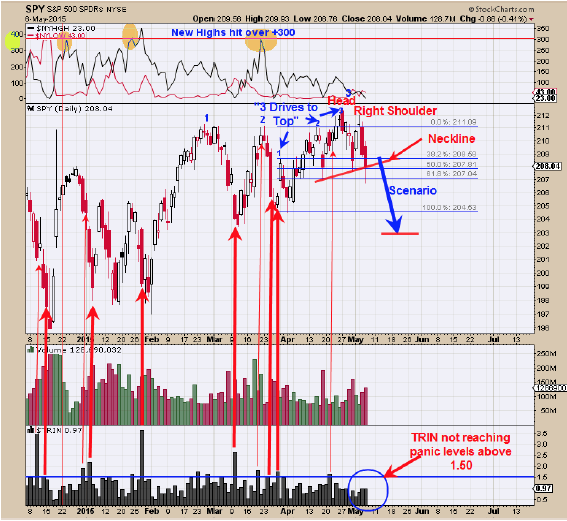
We have concluded on previous reports that a “Three Drives to Top” was forming which has a downside target near 204. There also appears a “Head and Shoulders Top” formed where the Head is the April 27 high. This Head and Shoulders top have a measured target to 203 on the SPY. To help identify the next low, there should be panic and clues to find panic in the market is through the TRIN, TICKS and VIX. Today the TICKS closed at minus 455 and in panic levels but the TRIN closed at .97 and not at panic levels (TRIN panic levels is above 1.50). For bottoms to form both TICKS and TRIN should be in panic levels and ideally the VIX would also reach panic levels near +20. On the chart above we have labeled times when the TRIN reached over 1.50 with bold red Arrows. Sometimes the TRIN have high readings at tops to warn a declining is coming and those instances are noted with skinny red arrows. The TRIN so far is not identifying panic and that implies the trend is still down. Short SPX at 2106.85 on 4/29/15.”
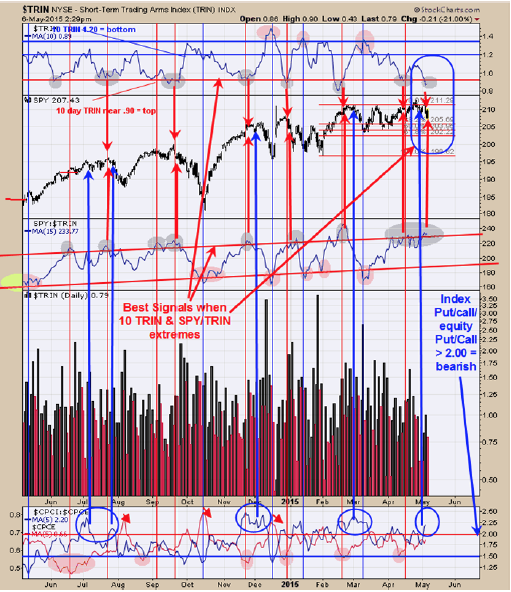
The top window in the chart above is the 10 day average of the TRIN. The window below the SPY window is the SPY/TRIN ratio with a 15 period moving average. The best signals for a top come when the 10 day TRIN < .90 (current reading is .89, marked with gray circle) and the SPY/TRIN ratio is above the upper red line (marked with gray circle) and as you can see both indicators are at extremes even though the market has declined. Since both 10 day TRIN and SPY/TRIN ratio are still at extremes it would suggests the decline is not finished. The bottom window is the CBOE index put/call/CBOE equity put/Call with a 5 period moving average. When this ratio is above 2.00 (current reading is 2.20) the market is near a high. This ratio also suggests the current decline is not done. For bottoms to form in the market, panic readings are needed and so far on the indicators on this page, panic is still absent.
Today’s decline in GDX appears to be breaking support near 20.20 range, though a rally tomorrow above 20.20 would suggests the support held. However if the decline continues would suggests the pattern that has been forming since the early March low is a “Rising Wedge” pattern. This pattern would have a downside target to where the pattern began which is near 17.25 range. Notice that the rally from the early March low retraced 61.8% of the decline from the mid January high and if GDX did test the early March low near 17.25 it would imply a double bottom could be forming in that the last rally up retraced 61.8% of the previous decline. Since the rally up was a deep retracement of the previous decline the next time down normally form a double bottom and something we will be watching form. We have a cycle low due in July to August timeframe and may be where a “Sign of Strength” may develop.
-TIm Ord
For examples in how "Ord-Volume" works, visit www.ord-oracle.com. New Book release "The Secret Science of Price and Volume" by Timothy Ord, buy on www.Amazon.com.