
Monitoring purposes SPX: Short SPX on close (4/29/15) at 2106.85.
Monitoring purposes GOLD: Flat
Long Term Trend monitor purposes: Flat
Timers Digest recorded the Ord Oracle #6 in performance for 3 months updated March 9, 2015.
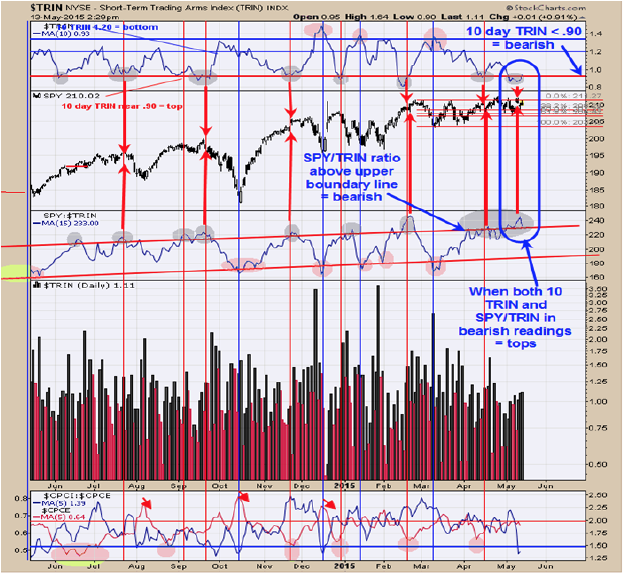
The top window is the 10 day average of the TRIN. Readings below .90 suggests the market is near a high. Since the beginning of May the 10 day TRIN had consistently stayed below .90. The SPY/TRIN ratio is above the upper boundary line and where market highs usually form. When both the 10 day TRIN and SPY/TRIN ratio are in bearish territory is when the reliability for a top is high and that is where these indicators stand now. This chart remains bearish. I might add that the Ticks reached an intra day high of +1394 last Friday and the last time that intraday Ticks reached this high came on March 18 with a reading of +1436 which was two days from a top. Short SPX at 2106.85 on 4/29/15.
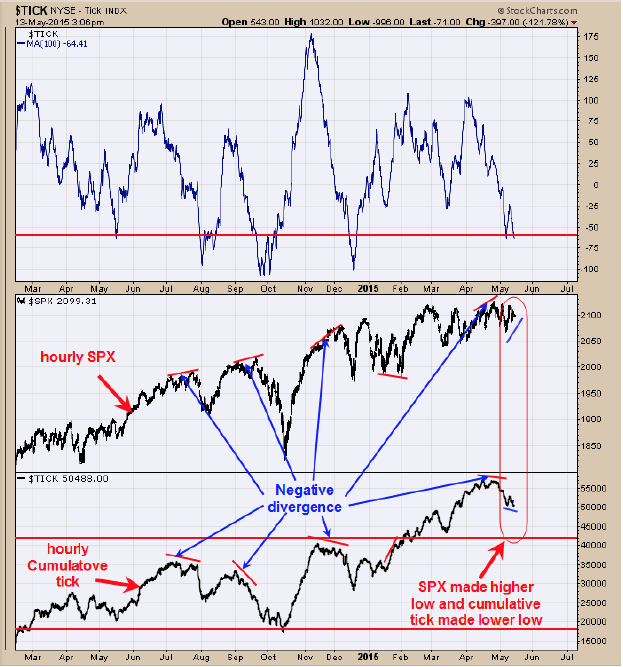
The bottom window is the hourly cumulative tick and above that is the hour SPX. The hourly cumulative tick can give warnings for reversals in the SPX by producing divergences. Divergences showed up at the July, September and December 2014 highs where the SPX made higher highs as the cumulative tick made lower highs. The cumulative tick in April of this year started to make lower highs and he SPX made higher highs and suggesting the market is near a high. Notice that the cumulative tick is making lower lows and the SPX has made higher lows since the beginning of May suggesting the market may weaken soon. This week is option expiration week which normally has a bullish bias and may be the reason market is holding up so far. Still expecting a pull back here but biggest part of the decline may show up next week.
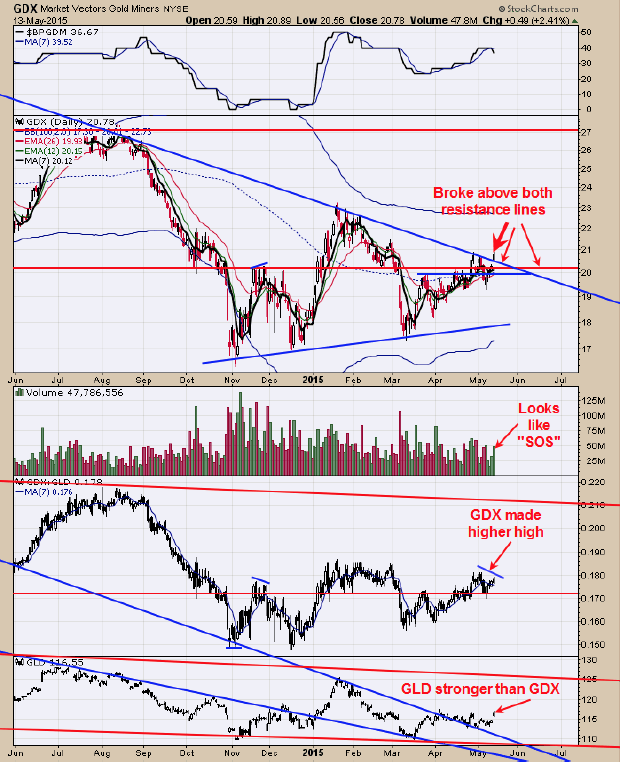
Today GDX broke above the downtrend line form the October 2012 high and the horizontal trend line that comes in near 20.20 range and looks to have done so on a “Sign of Strength”. A “Sign of Strength” breakout would be a bullish longer term sign. The last five days in GDX have been up and suggests the short term trend is extended and a pull back could develop short term. If in deed today’s rally is a valid breakout than 20.20 range on GDX should hold as support. On today’s rally we noticed that the GDX/GLD ratio made a lower high as GDX made a higher high and a short term negative divergence, which may mean that a short term pull back is in order. For now the picture is back to bullish but a minor pull back may develop short term. The 20.20 range on GDX is support and a place to watch for bullish signs.
-Tim Ord
For examples in how "Ord-Volume" works, visit www.ord-oracle.com.
New Book release "The Secret Science of Price and Volume" by Timothy Ord, buy on www.Amazon.com.